Breakpoint Trades
Wednesday, September 30, 2015
NYMO McClellan Oscillator Mechanical system - the buy signal from this system once again played out for a trade!
China PMI this evening, lately that's been moving futures, we'll see if we get a reaction or not
SPX 30 min follow up, broke out of that channel, yesterday's low had clear positive divergence via MACD/RSI
SPX daily yesterday formed doji candles, today large candle formed a bullish morning star, price still below 9EMA
RUT and IWM 15 min views, possible little Inv H&S cup and handle. Yellen speaks here in a few min though
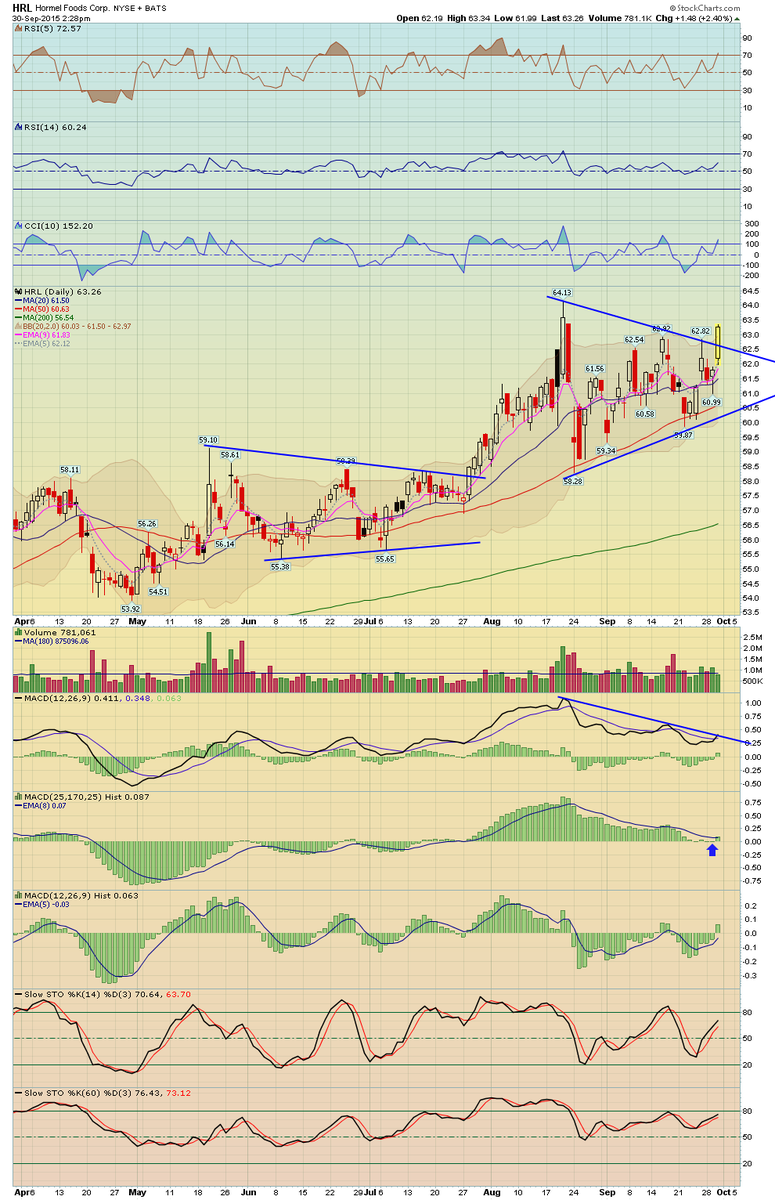
HRL long idea follow up, broke out of the triangle pattern today
SPX 30 min view, price formed a bull flag and bounced off the MA's, monitor the downtrend line
SPX 60 min updated view, a perfect kiss of that broken trendline resistance and reversal back down!
SPX 60 min view, bounced up to the trendline resistance zone, an area to monitor
Nice rally from the perfect doji candlesticks on daily SPX cash. note the 9 EMA, and pivot and dotted trendline
Tuesday, September 29, 2015
HRL trade idea, price is coiling into a large triangle pattern, one to monitor
Update on BG posted earlier, some vol came into it late in day, we'll see if it can follow through
follow up to that 3 min triangle pattern, as you can see it broke down.
SPX 3 min, normally I would not post this short of a time frame here, but given the volatility
BG long idea, basing pattern holding up for now, also the 15 min has a flag pattern
60 min view of SPX cash, bounced this morning from oversold but overall no change in the pattern, note trendlines
if a doji forms, we have a precise mechanical strategy to show you how to trade these shown in our 5 hr recorded tutorial
So far doji candlesticks forming on the daily SPX cash chart
AAPL short idea follow up, been on our short list for a while, finally broke down some today
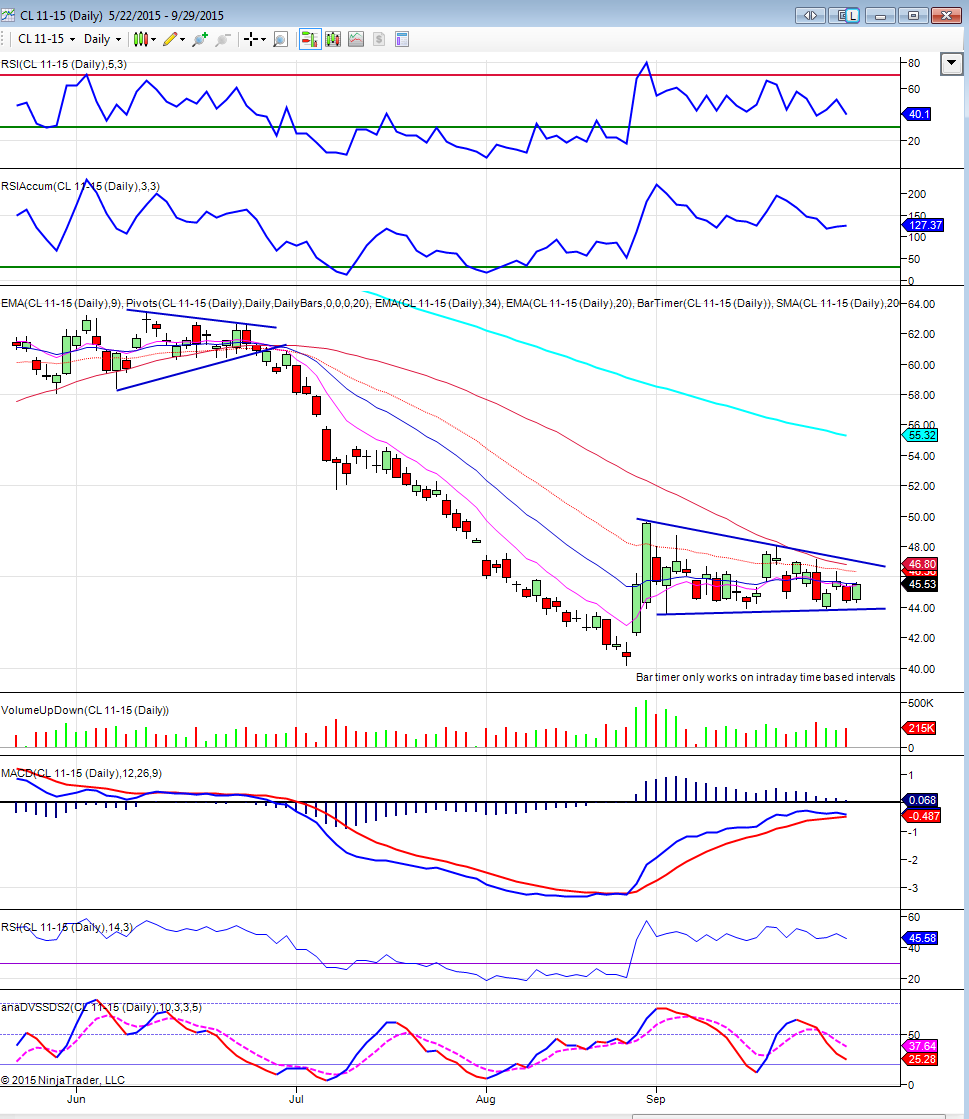
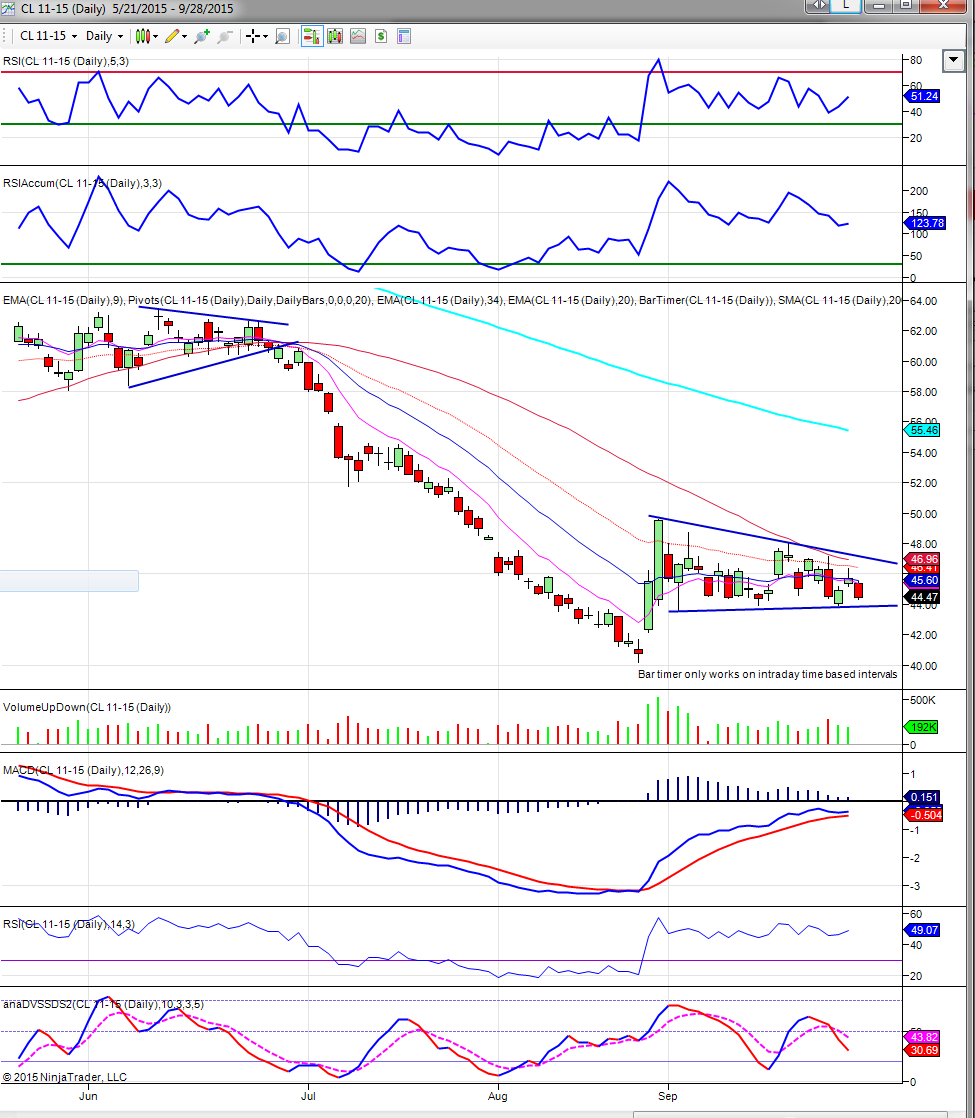
Crude Oil getting tighter than a drum, building up energy coiling into this pattern and MA's are pinching
The NYMO McClellan Oscillator closed below it's lower Bollinger Bands Yesterday
Perhaps some capitulation/washout is occurring in the Biotech sector, note the substantial vol increase
SPX monthly view, I find this chart fascinating how time symmetry here called the top!
SPX cash daily views, note the Aug lows and the daily pivot
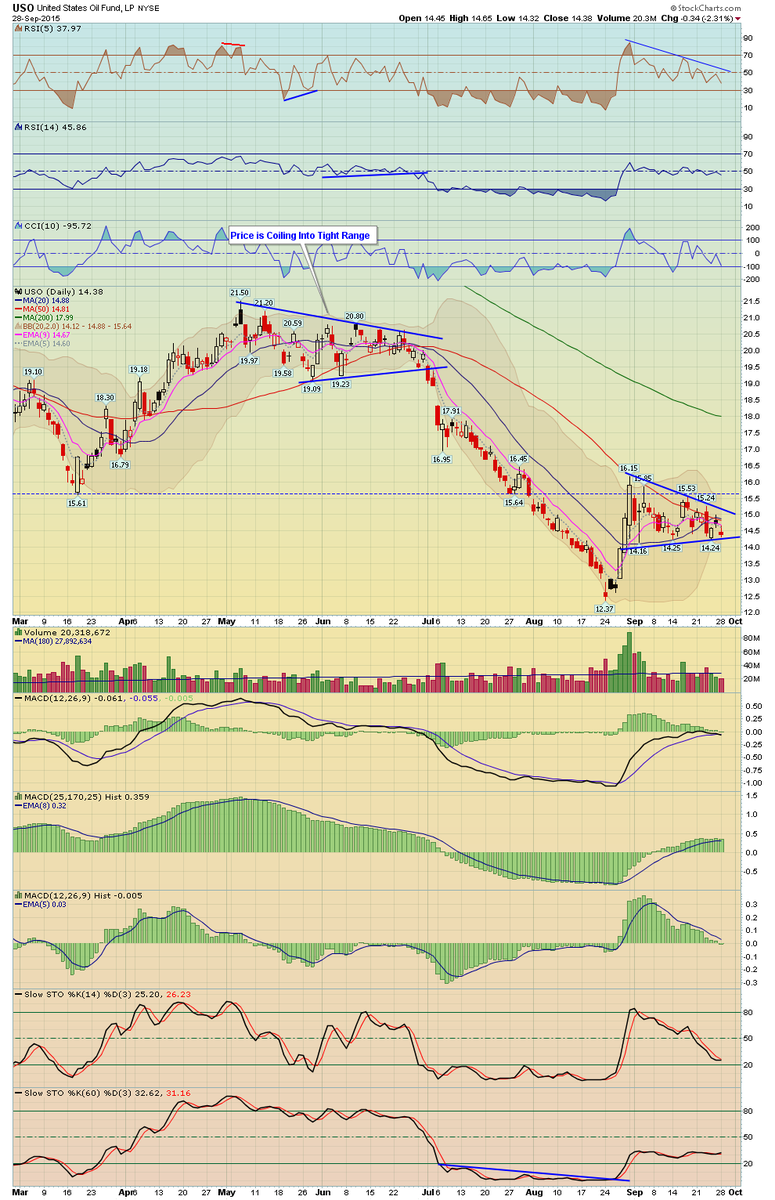
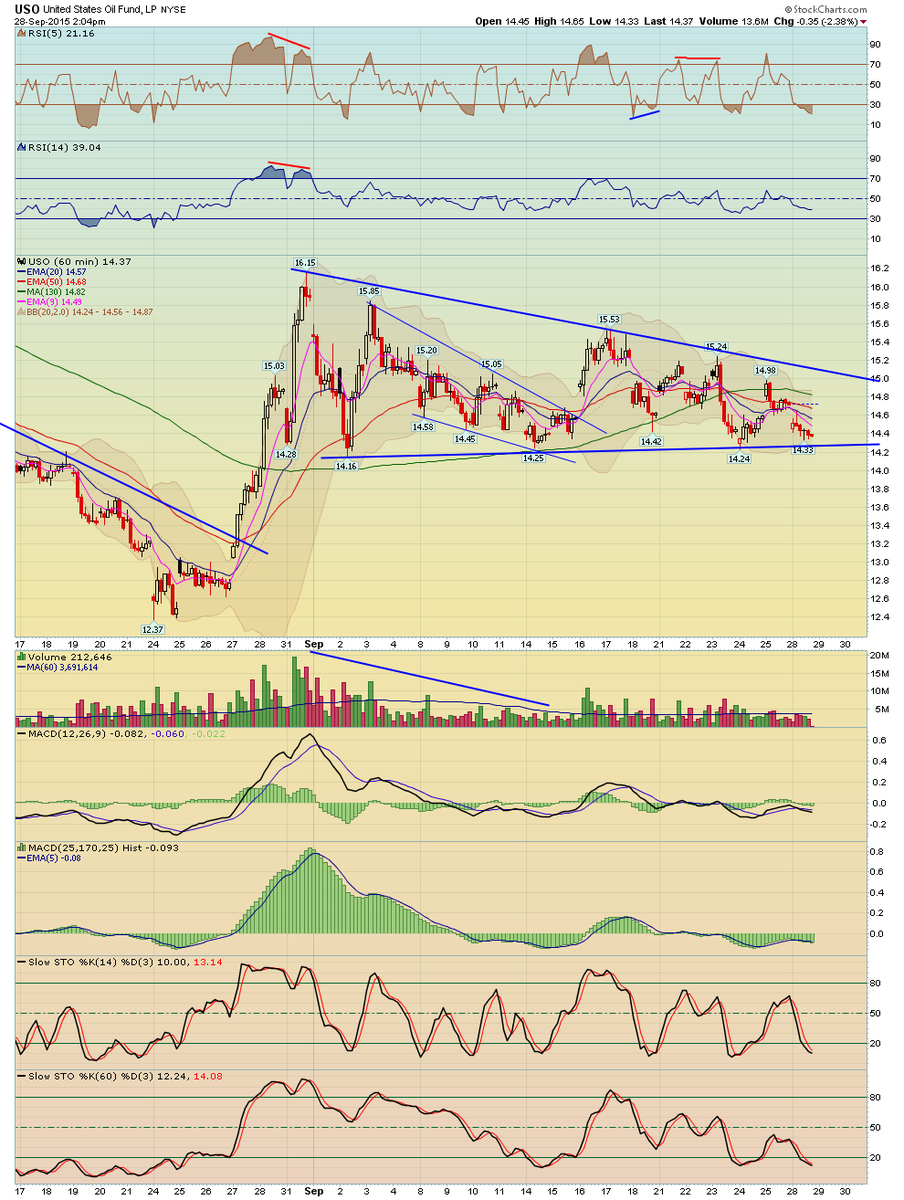
USO crude ETF, getting tight in this triangle pattern, here's a daily and 60 min view
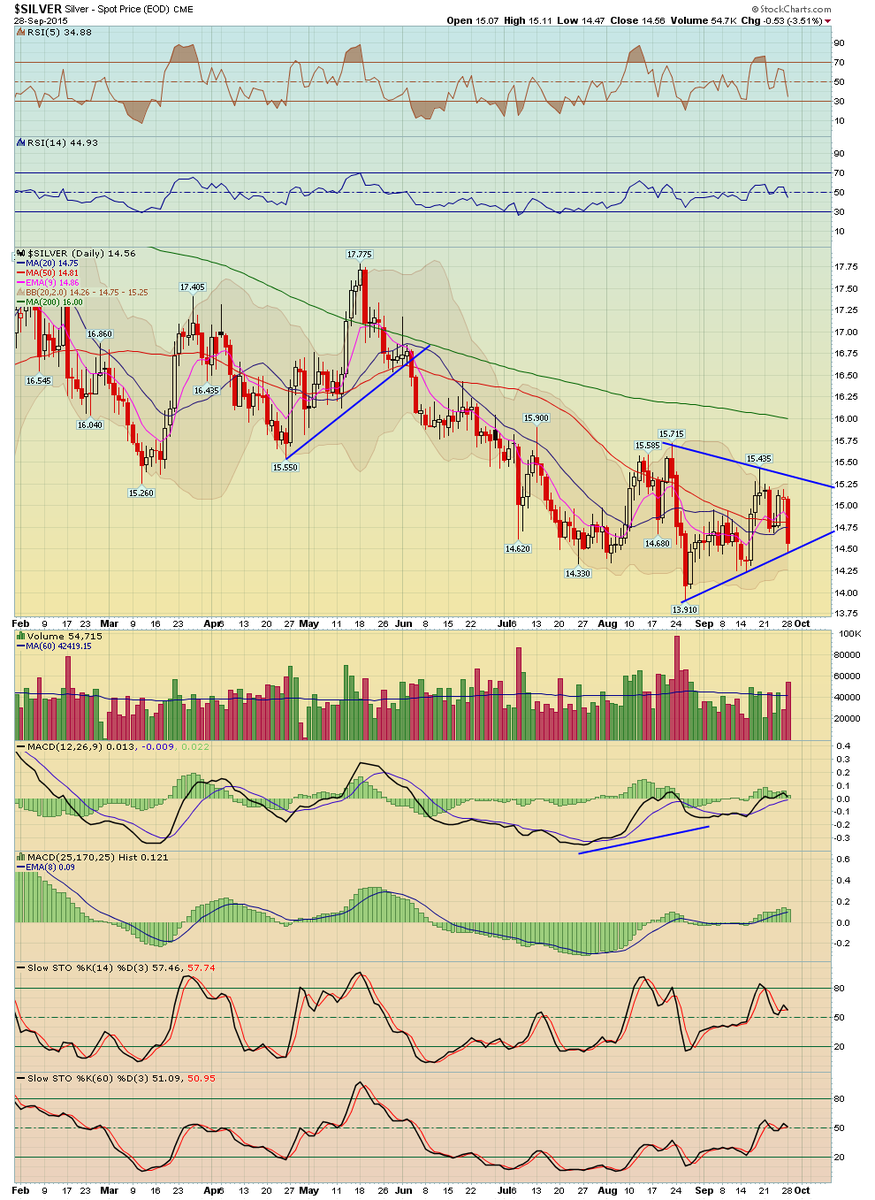
Daily charts of Silver and Gold, triangle patterns
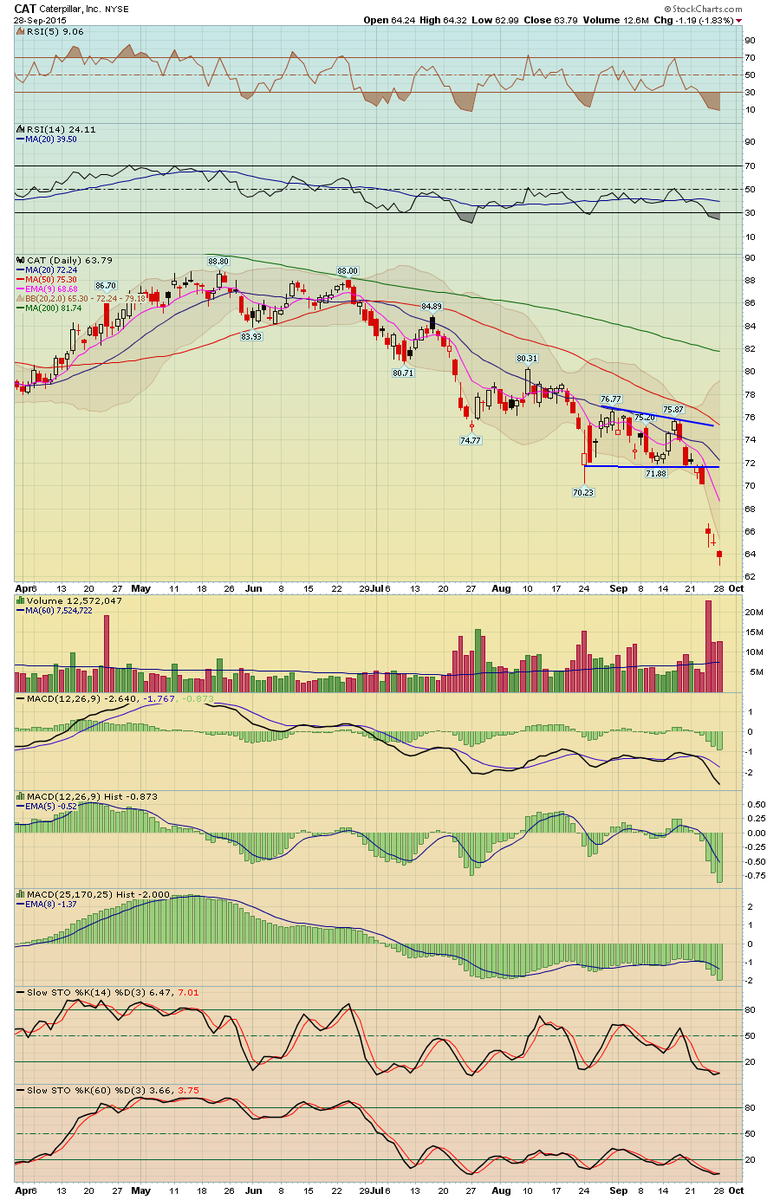
Make sure to take some profits on these short idea's we've had, ASH, POT, SEM, CAT
ABX daily look, gold stocks down today as well but overall it's still in the same wedge pattern
Monday, September 28, 2015
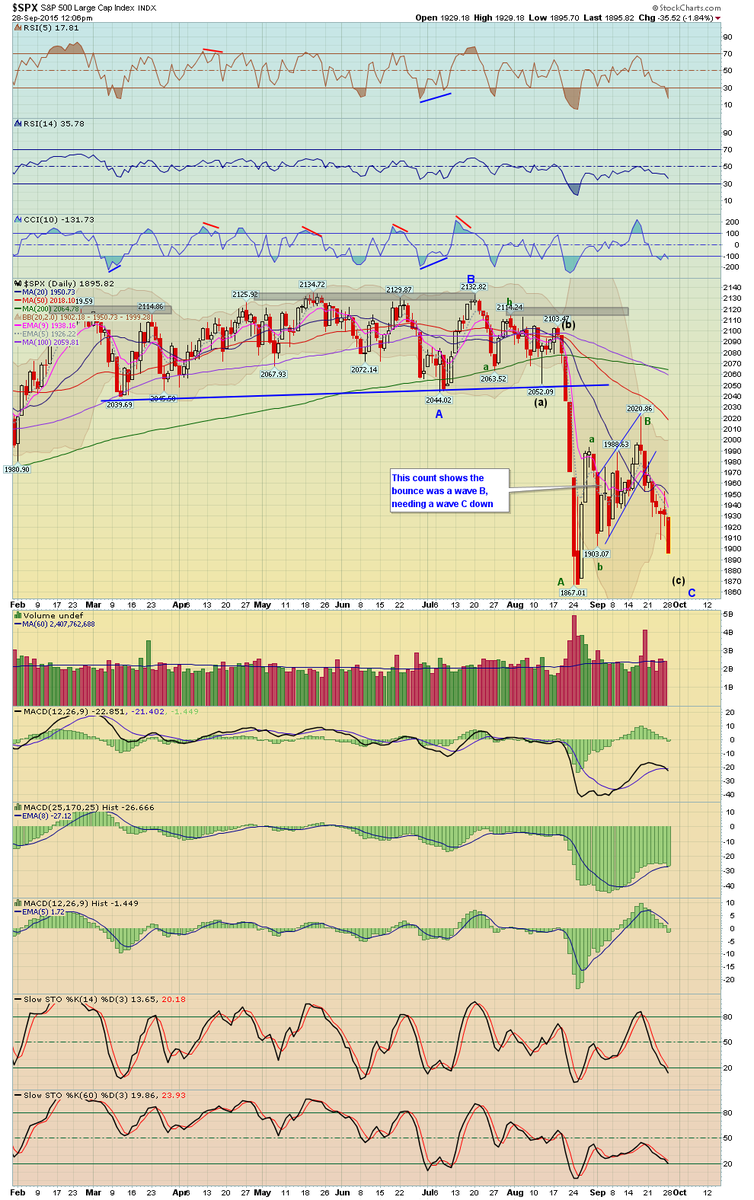
SPX daily with pivots, 1910 pivot range and down she went...1869 range next target over time. (1862-1877)
Crude Oil Daily and USO ETF 60 min, still in the pattern for now, will it hold support or break it?
Russell 2000 day index, the first major cash index to undercut the Aug lows. The others will likely follow
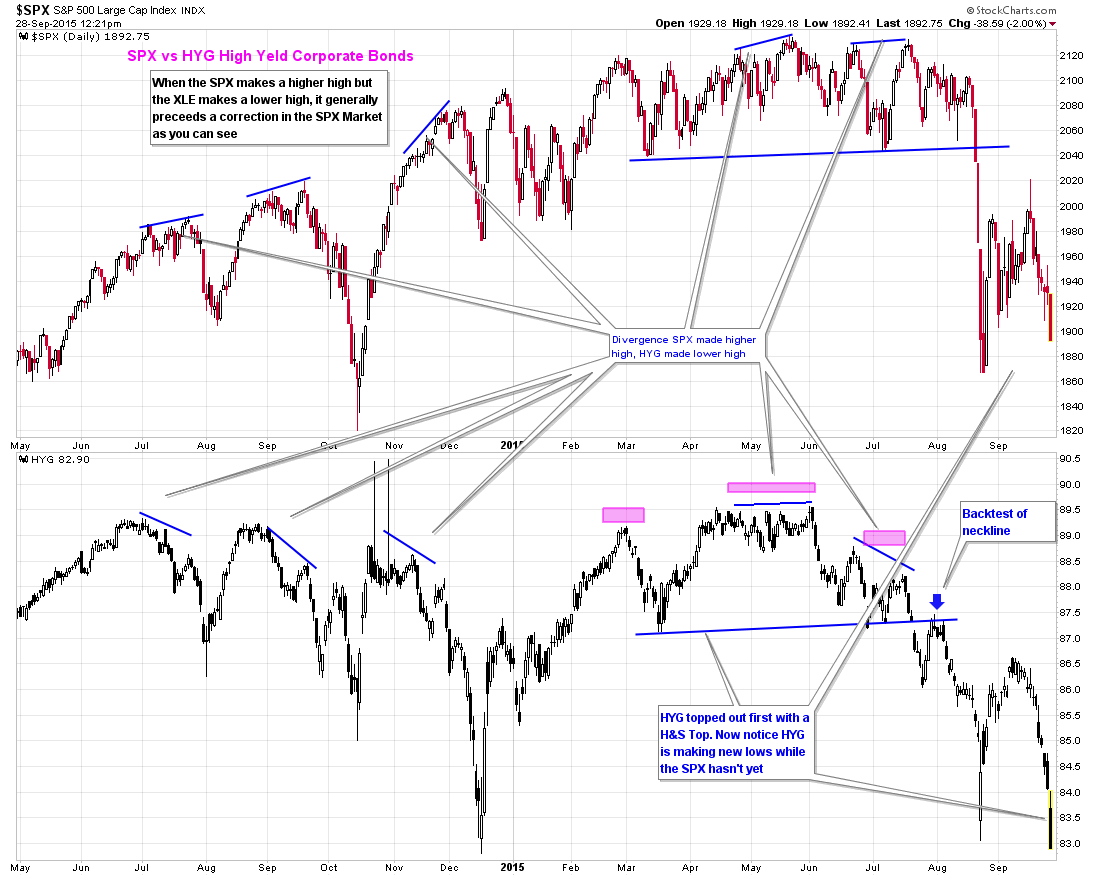
HYG High Yield Corporate Bonds, has been leading and topped out first. HYG making new low, SPX not yet
Daily SPX cash index views, bear flag continues to play out etc
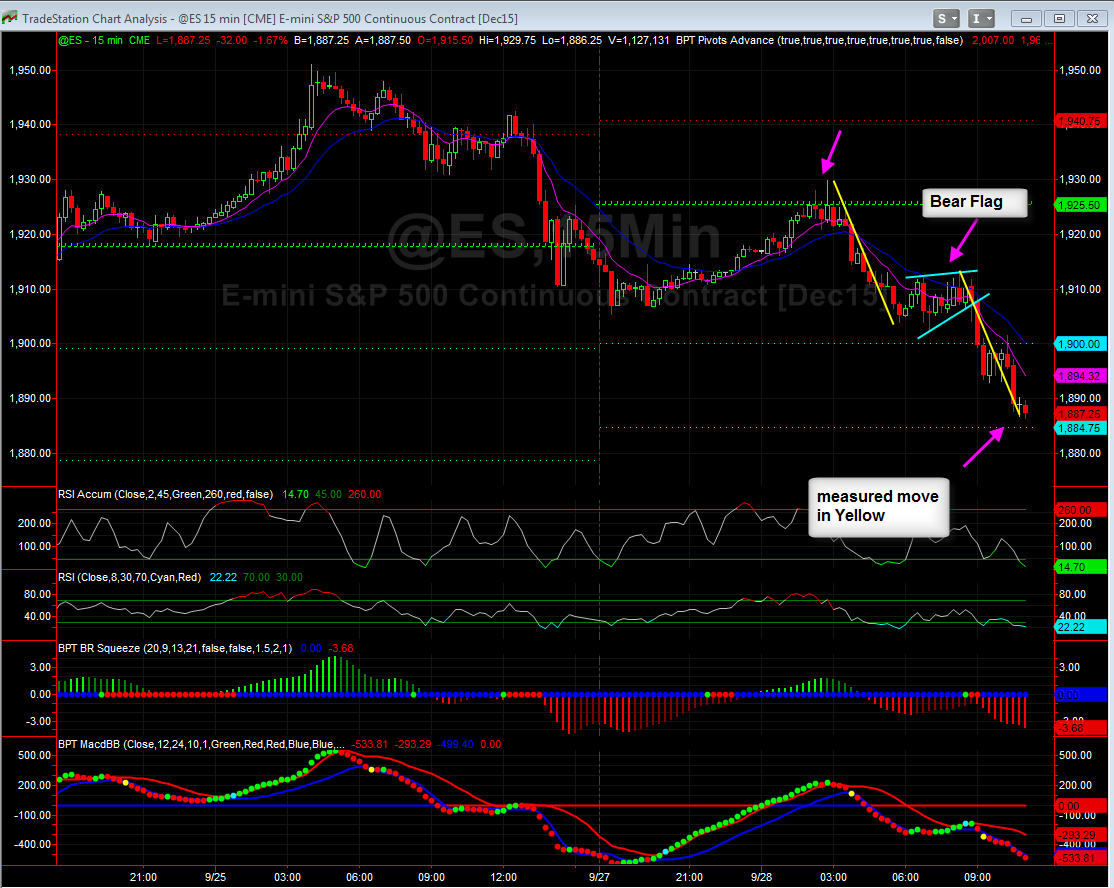
Updated view of the 15 min ES futures, bear flag hit a measured move and near S2 pivot
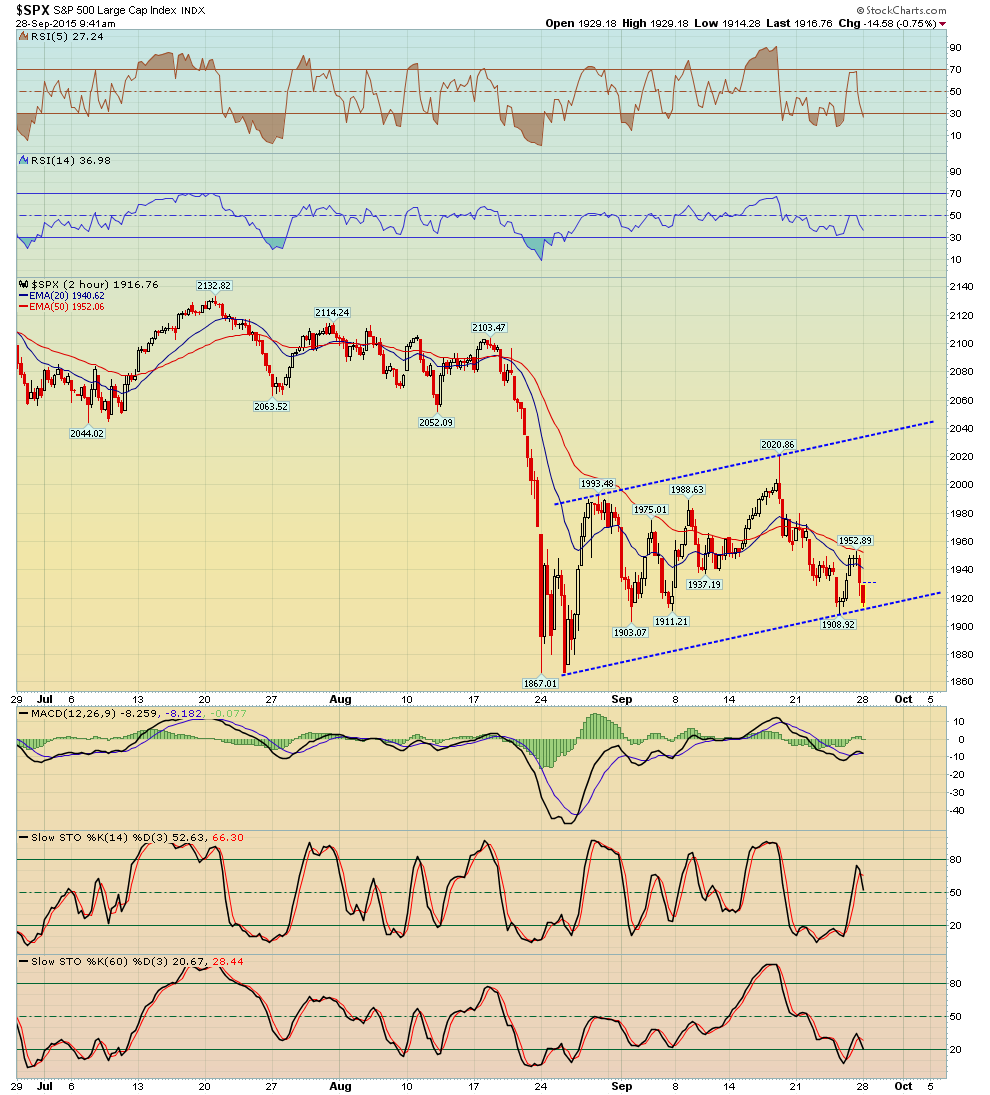
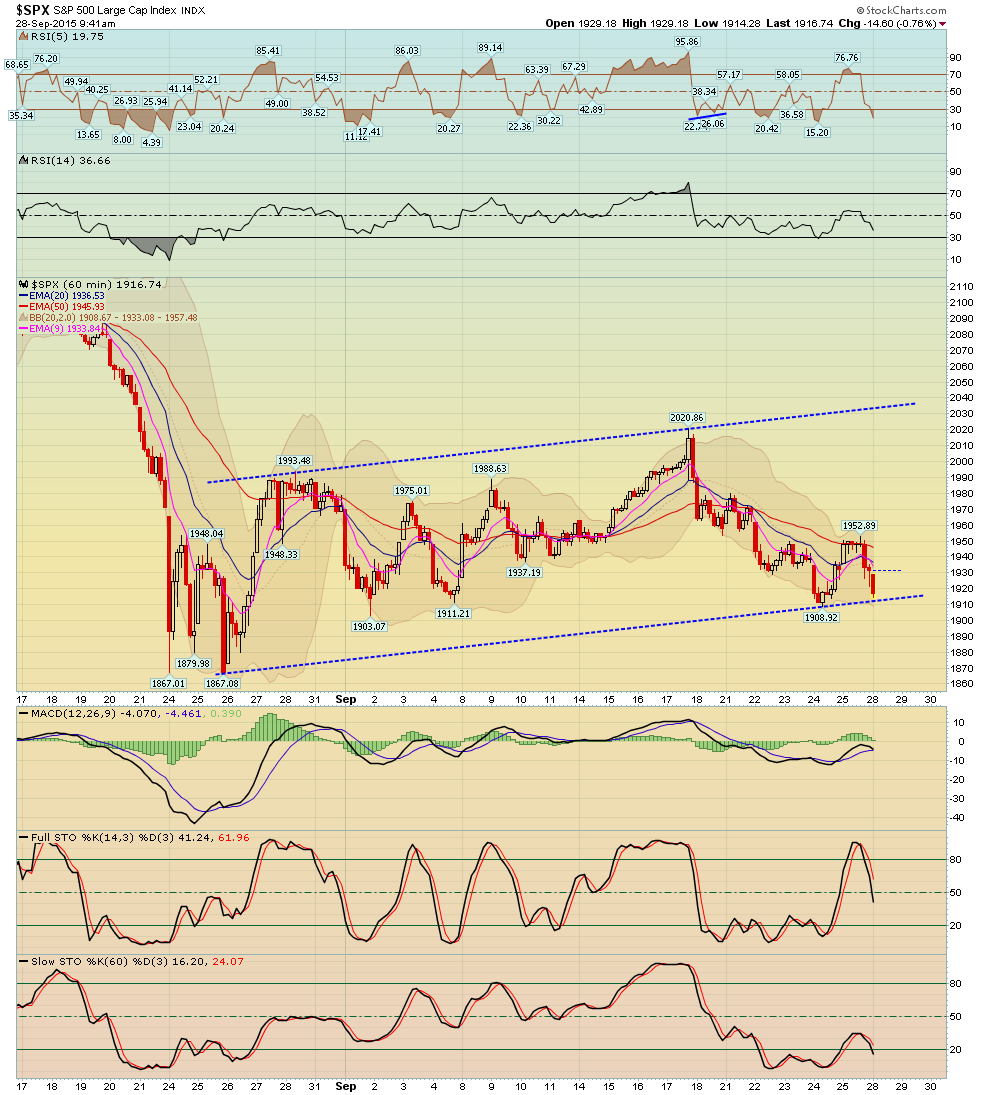
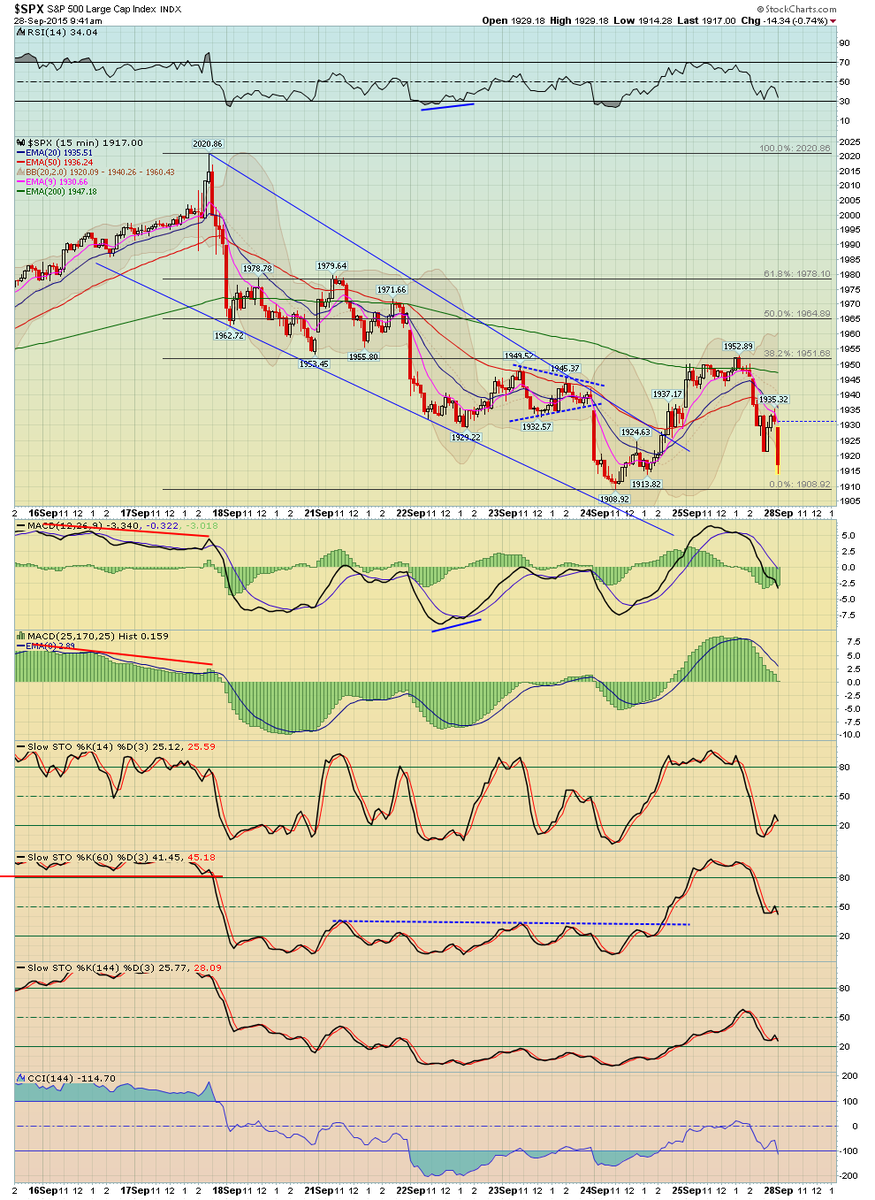
SPX cash Intraday Views, refer to trendlines
‹
›
Home
View web version