Wednesday, March 28, 2012

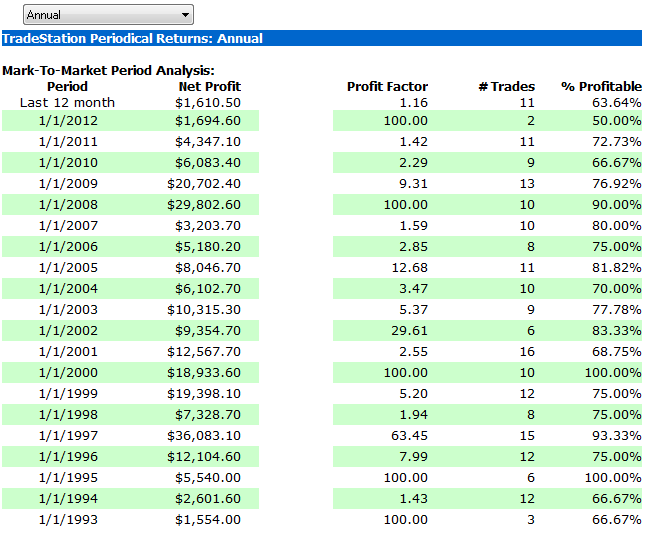
Sell in May and go away Statistics

We've all heard of the old Wall Street Mantra, 'Sell In May and Go Away', here's a table of the detailed Statistics.


Click here to watch the video where I describe the statistics in more detail


**please note, if you click on the URL and you get a blank screen, please refresh the page and you should see the video play button.

INWK trade idea

INWK - here's a long idea that held up well today with decent volume.  Resistance is the upper trendline.

AAPL 60 min

AAPL - As you know, the uptrend line AAPL has been astonishing. However it's one to once in regards to the general market, since it represents about a 15% weighting with respect to the Nasdaq 100. Here's a 60 min chart, perhaps a bear wedge is forming inside the uptrend channel, and there is negative divergence; something to watch!

well one thing that has bothered me about gold is ...

well one thing that has bothered me about gold is that it is typically dead money in the summer usually starting in May, and it's almost April now.  One possibility I discussed was for gold to possibly spend the the next 5 months forming a large triangle pattern, it would basically be a choppy up and down mess, then rally in late July or Aug when Gold historically picks up


see my chart, again even if it forms a triangle, it might not be exactly like this, it's an illustration

Monday, March 26, 2012

Newsletter Mar 27th 2012

Click the link below to view the most recent newsletter.  This one contains lots of good stuff: market analysis, mechanical systems, precious metals, and great trade ideas


Newsletter Mar 27th 2012

US Dollar update

the H&S pattern is playing out, here's the 60 min UUP and 233 min Dollar index

Copper

$COPPER - nice rally in Copper today, I've had this drawn as an ABCDE triangle for a few weeks now.  If that low was truly wave E, that should have completed the consolidation and copper should now be ready to breakout of the pattern to the upside.

NFLX comments


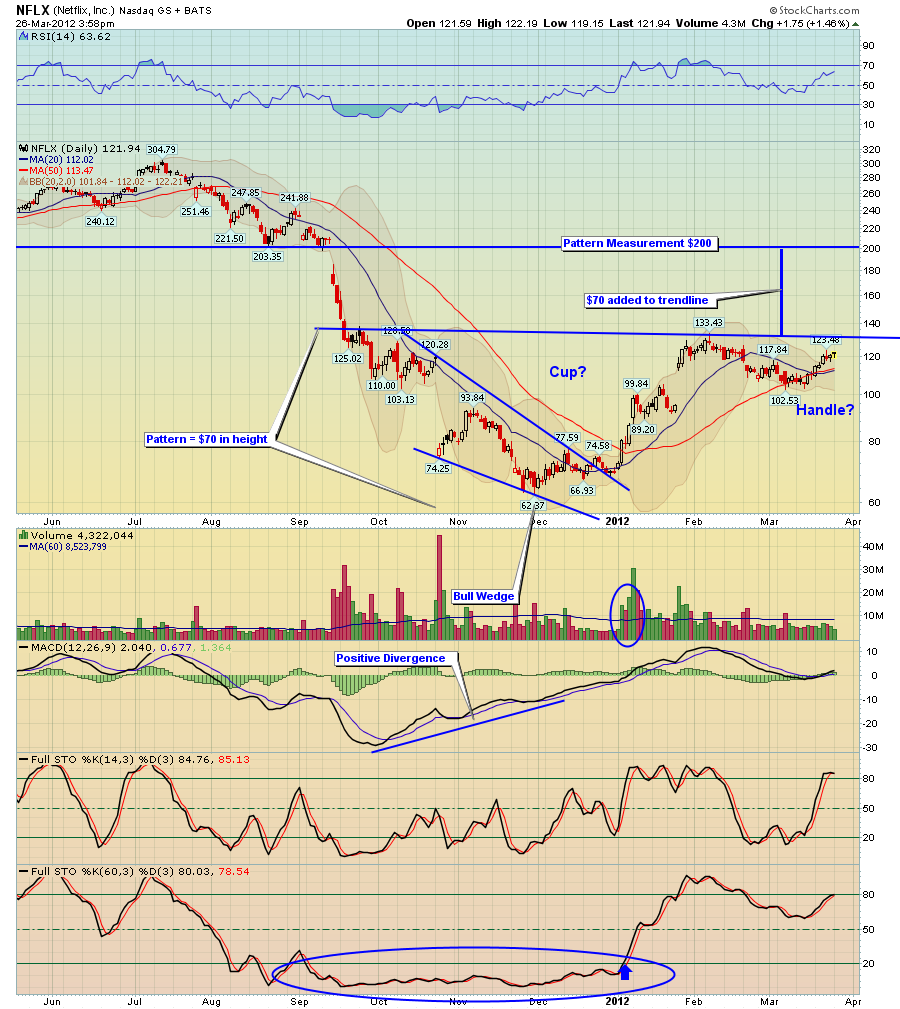
NFLX - a member asked me about NFLX if it could be forming a cup and handle pattern.  Yes perhaps, it was an old pick of ours back in Dec which played out well, of course I didn't hold it the 70's to $130, heck of a run


anyway the cup and handle pattern is valid, but you want to see volume pick up on a breakout, if it were to sell down again and take the Mar low or spend too much time going sideways, then it would no longer be this pattern.  What troubles me somewhat is the time of the year, we are fast coming up on the sell in May and go away, which actually starts in April if you get a MACD cross via the MACD timing.  so will it have time to play out to target about $200 before sell in May hits? IDK.  


also it's plotted on a log chart, and is why it looked condensed. the pattern is approximately $70 points in height, so if you add this to the trendline, you get about $200, which also matches up nicely with previous support back in Aug.


who knows,we'll see I guess....


NUVA Setup

NUVA


Would like to see volume percentage increase clearing 14.50 area....

BIDU Update

BIDU


Reaching some initial target zones and measured moves......

DRIV trade idea

DRIV - nice cup and handle pattern

60 min UUP,USD

UUP - H&S starting to play out, this is a 60 min chart, however the daily Euro chart as a H&S pattern, so once this short term chart is played out, perhaps the larger one on the Euro will begin to play out

Sunday, March 25, 2012

GDX daily

GDX - Zooming out a bit, GDX is once again attempting to find support at the lower trendline, which now has 6 touches

Thursday, March 22, 2012

RSI 2 SPY Stragegy

The RSI 2 Strategy triggered today as RSI 2 length fell below 10%.  Here's the stats to the system, and the rules


Longs: RSI 2 closes below 10% and price is above the 200 SMA.  Exit longs when price closes back over the 9 SMA


Shorts: RSI 2 closes above 90% and price is below the 200 SMA.  Exit shorts when price closes back below the 8 SMA


where this system get's caught of course is during market inflection points i.e. a downtrend is starting or an uptrend is beginning 

For the GDX weekly, it would be nice to see ...

For the GDX weekly, it would be nice to see those stochastics get fully oversold, they are getting close but still not there, matters though what it looks like on Friday's close

yes divergence is building on the 60 min, here's my ...

yes divergence is building on the 60 min, here's my chart.  both stochastics are oversold again so that's good.  you need to see MACD cross back up to confirm the divergence.  For now GDX is still wedging down.  Also watch the GDX/GLD ratio trendline

Wednesday, March 21, 2012

cycle chart

here's a chart that was sent to me, but I dont' know who the author is, otherwise I'd give credit. Interesting chart, but who knows.


Personally though I do think we'll see a sell in may again this year, though I would not surprise me to see it earlier such as in April sometime, we'll see I guess.  

Sunday, March 18, 2012

Weekend Commodity Newsletter Sunday Mar 18th

I went a little overboard on the commodity newsletter this week, covers tons of stuff, here you go!


Weekend Commodity Newsletter Sunday Mar 18th

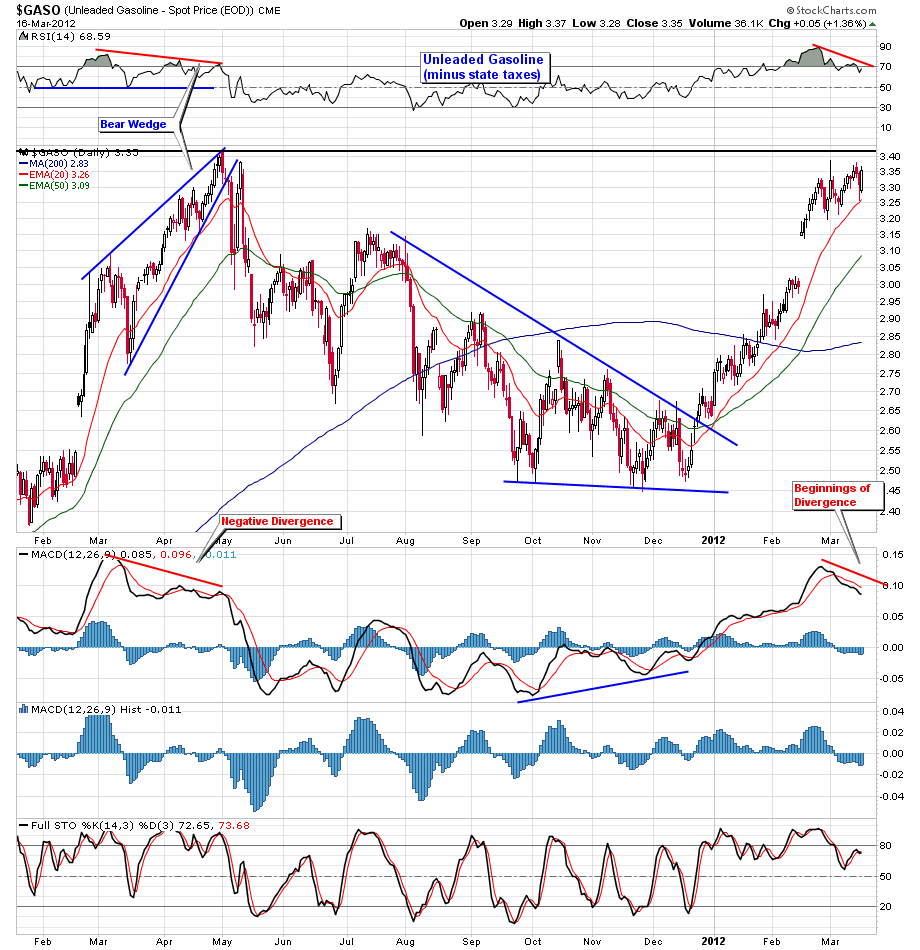
Unleaded Gasoline

$GASO - Unleaded gasoline (does not include taxes you pay at the pump), some preliminary Neg Divergence forming, however note what happened last Mar, price rallied for another 1 1/2 months to form a longer divergence. 


$GASO - weekly view, see the long term trendlines/resistance, breakout out over those would be painful at the pump

A Few Misc commodities

Here's a few Misc commodities that I wasn't aware Stockcharts.com tracked


$SOYB - Soybeans, been strong since it broke out of an inverse H&S pattern back in Feb


$SUGAR - interesting pattern, I'm curious to see if the trendline can be taken out


$WHEAT - Ascending Triangle forming?

USO - 60 min view of USO Crude ETF, the correction ...


USO - 60 min view of USO Crude ETF, the correction has been overlappy and choppy, suggests an eventual upside break


$WTIC - crude daily, the pattern still continues to look bullish, it has consolidated over resistance and now the Ratio is turning up and MACD is above zero.


US Dollar is down 40 cents, so that will help


OIH - Oil Services - interesting pattern to watch, volume has been light

Thursday, March 15, 2012

Hello everyone, here's our comprehensive Thursday newsletter covering the general market, Treasuries/Bonds, Copper,Coal,Nat Gas, Gold, and some trade ideas.

Enjoy your Friday and have a great weekend!


Thursday March 15th, 2012 Newsletter!


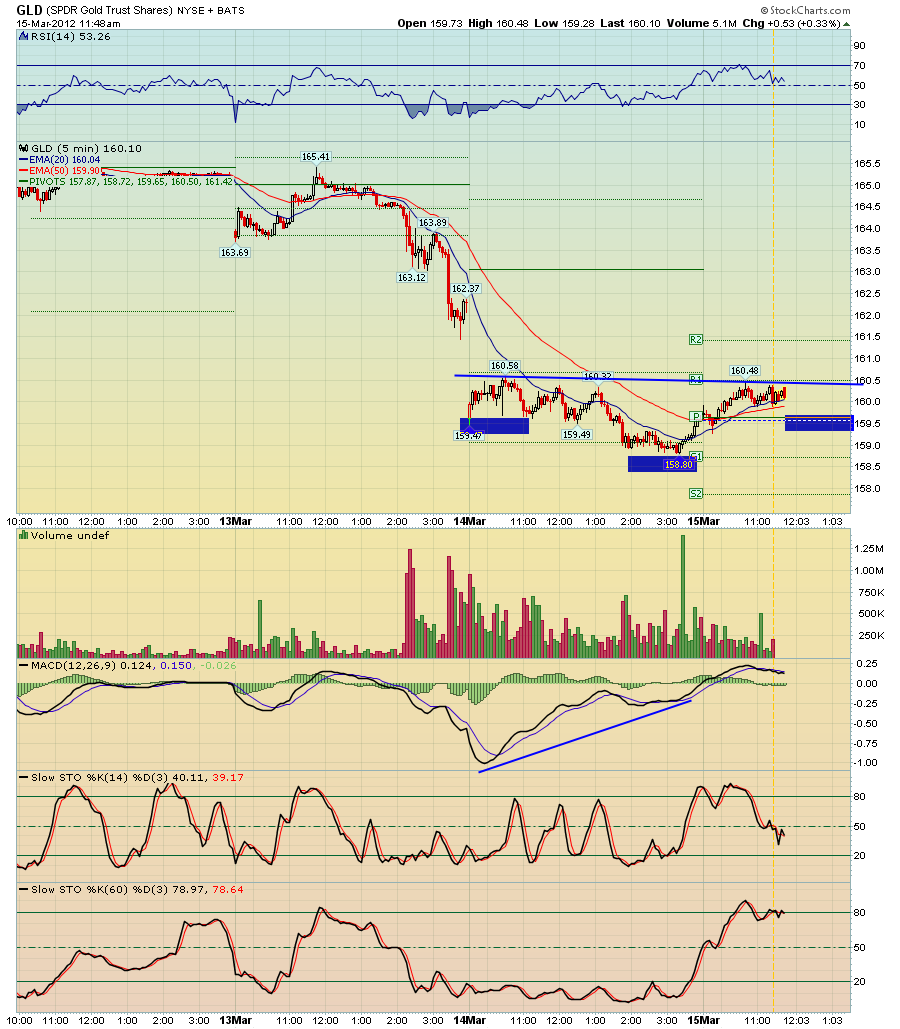
GLD 5 min and 60 min comments

GLD - perhaps an inverse H&S is setting up? 


GLD - 60 min view, however as I stated last night, the 60 min chart needs a lot of work, perhaps it's forming a wedge, but wedge patterns have 5 waves or ABCDE, right now we only have 3, therefore a bounce may be wave D, then another down in E?

Tuesday, March 13, 2012

here's a shorter term view

here's a shorter term view

Natural Gas, UNG and BOIL had a big surge

UNG - UNG and BOIL had a big surge in the last 30 min


UNG 60 min view


BOIL

TBT

TBT - looking more interesting here, nice base forming

sell in may stats

That would be great Matt, looking forward to it.

Monday, March 12, 2012

Choose Your Own Adventure: SPX 2013

Interesting article for fun from 


Dynamic Hedge


The violent selloff and subsequent grinding higher feels very unique. Some have even said this market feels “unnatural” or “rigged” due to quantitative easing, high frequency trading, LTRO, ZIRP and other boogie men. I assure you these market conditions are not unique at all. Here are 5 examples of statistically similar markets and what transpired afterwards.


These instances were identified by our pattern recognition algorithm as self-similar in form to the market conditions we are currently experiencing. The requirements for this search was a substantial selloff followed with a choppy bottoming process and a grind higher taking out the previous highs. Spoiler alert: These instances (since 1970) overwhelmingly occur in bull markets and tend to lead to meaningfully higher prices.


For reference sake, here’s where we’re at:


Instance 1:


December 1989 – July 1990


The result is quite bearish:


Instance 2:


Actually embedded in instance 1 (freaky): July 1990 – March 1991


The result: Higher prices


Instance 3:


January 1994 – March 1995


The result: Super bull


Instance 4:


February 2005 – July 2005


The result: A pullback and new highs


Instance 5:


April 2010 – November 2010


The result: This instance is fresh in our minds and most will remember a shallow pullback and higher prices.


Instance 6:


The present


To aid your visualization I’ve included the appropriate negative space for both a bullish and bearish outcome.  There is room for both interpretations, but the choice, as always, is up to you.


Bullish:


Bearish:


Friday, March 9, 2012

Regarding Google, it appears to be forming a large H&S ...

Regarding Google, it appears to be forming a large H&S top