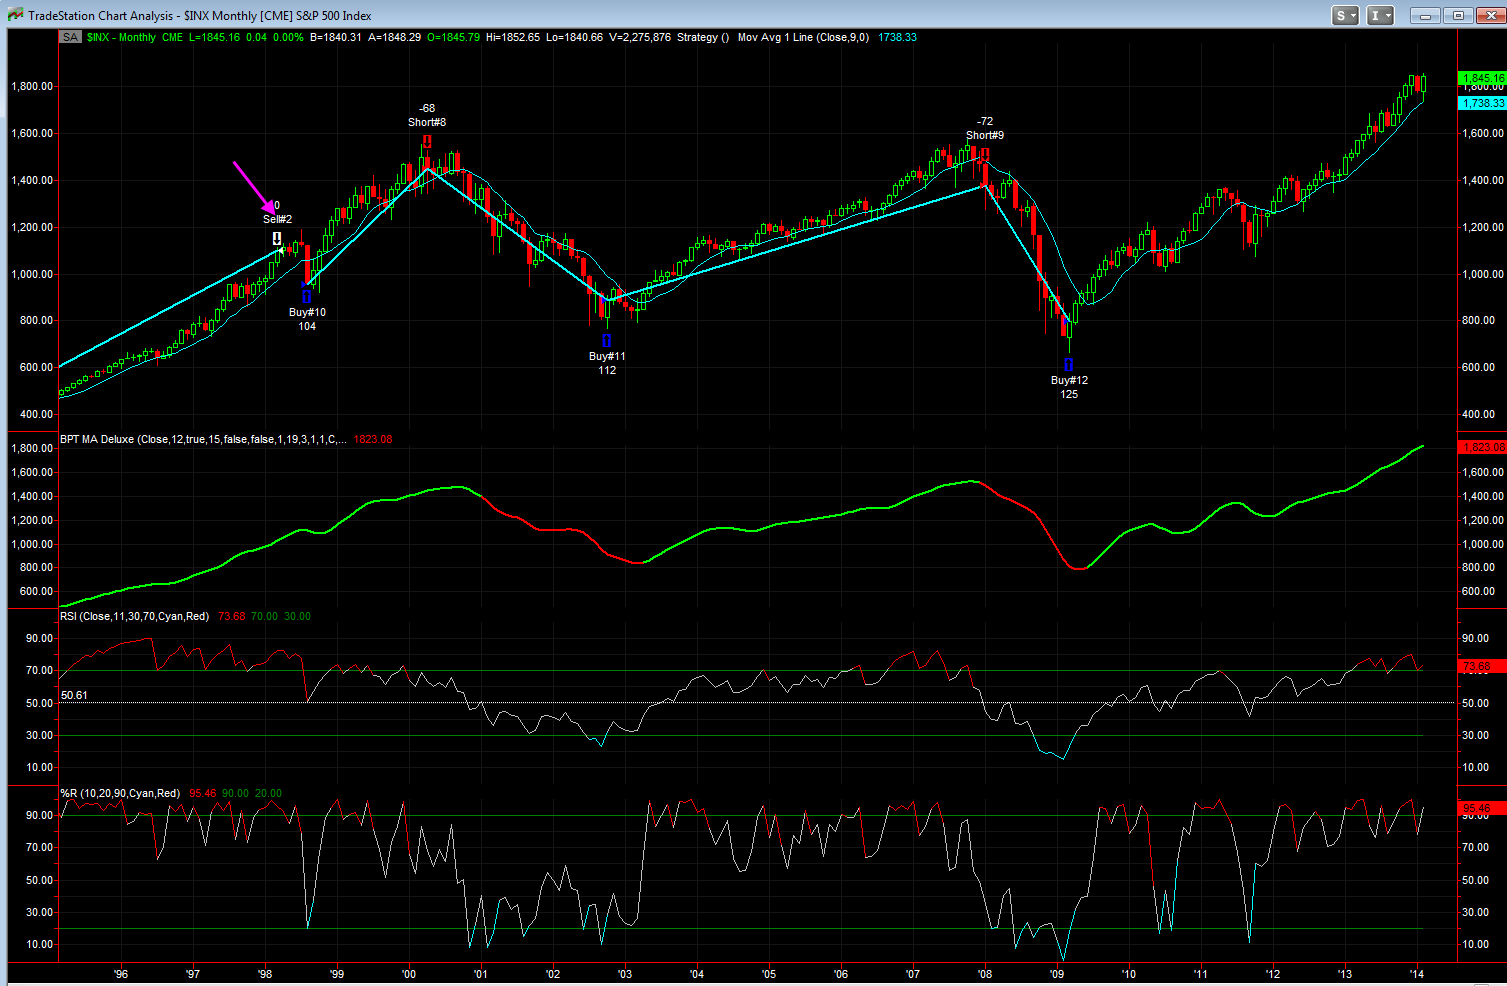
Hello everyone, as you know, a while back I developed a long term system based on a monthly chart of the S&P 500, it's affectionately called the 'paint dry' system because the trades can last for years. I designed it not for traders, but for family and friends, neighbors who do not trade the market and will never trade the market, but want to do better than buy and hold. The system is designed to keep you in entire bull markets but have you out for bear markets, for example the system went to cash in Jan 2008 and then went back long on Mar 31st 2009 just 3 weeks off the bear market bottom and is still long almost 5 years later. My Long only version of the system, from 1962 to present your money grew by 289 times the original investment vs 30 times buy and hold. For my long/short version your money increased by 534 times vs 30 times buy and hold - see the attached tables where the trade and stats are listed.
Currently the system has been in this long trade for 1794 days, the average is 1235 days, however the trade from Oct 2002 to Jan 2008 lasted 1918 days, while the long from Aug 31st 1984 to Aug 31st 1984 lasted 2191 days.
HOWEVER the system is going to go to cash at the end of this month because of a technical situation that has occurred with the market. It has to do with price closing for 20 months consecutively above the 8 MA along with the Willams% indicator above 90%. The system will be going to cash at the close of this month and will then look to buy a pullback. The last time the system did this was in Mar 31st 1998, it then bought the sharp pullback and went back long on Aug 31st 1998 (see the 3rd chart). Over the weekend I will discuss in more detail what this technical signal is. Do NOT take this is a sell short signal right now, and also the previous time this occurred the market stayed out for 3 - 5 months before having a hard pullback, if history holds true then maybe this portends to our market having a strong correction either in May or fall time frame for general seasonality.
I will discuss this briefly in tonight's newsletter, however I will discuss it in more detail on the weekend in a separate newsletter.