Sunday, March 31, 2013

Easter Commodity Newsletter

Hello everyone, I hope you are enjoying your long Easter Weekend!


Here's my weekend commodity newsletter for you to peruse when you have time, it's VERY comprehensive


*CLICK HERE* to view the newsletter


Again happy Easter,


Matthew Frailey, Breakpoint Trades.com

NYSE Specialists dressed up as Easter Bunnies


Have a good Easter Weekend!!


Friday, March 29, 2013

1st Quarter Market Statistics

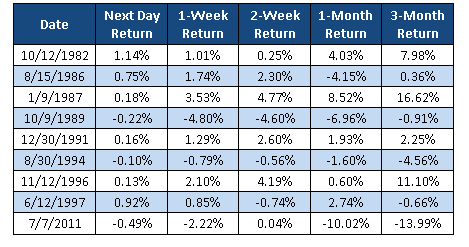
I've updated the table for the 1st quarter market statistics: This table shows every year since 1950 where the Dow Jones posted positive gains by the end of the 1st quarter; the table is sorted from highest to lowest Q1 change.  For additional information I also included the gain/loss for all the quarters, and also include the presidential cycle. 


As you can see, 36 out of 38 years (95%) the market has closed out the year with strong gains, with only 2 exceptions (1981 and 2002), even 1987 still managed a 2.3% gain for year despite the large 1987 crash! To put this into context, if the 1987 crash hadn't occurred the Dow would have gained about 20% for the year.


This year the Dow gained 11.3% for 1st quarter 2013


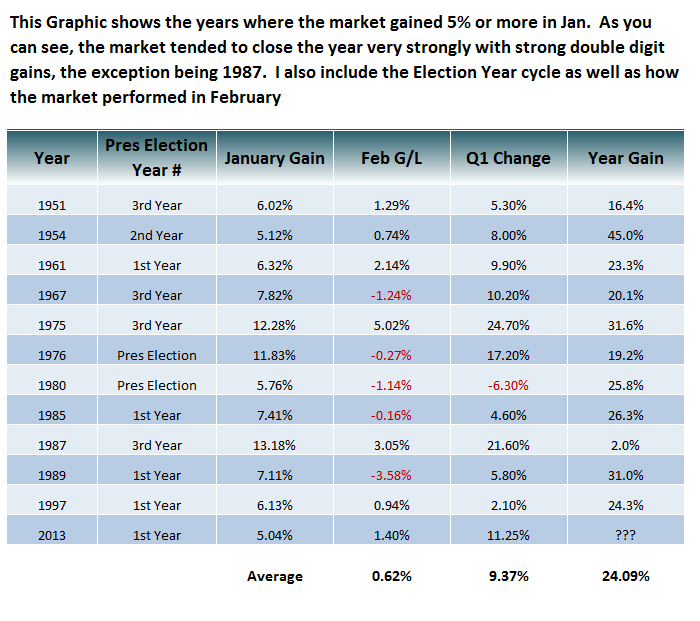
The second chart shows the statistics for the year after a strong January gain of 5% or greater.


Therefore I think the odds favor that 2013 will close out the year end with strong gains despite what the ultra bears think.


However I don't expect it to be all steady eddy.  I think that we are going to experience another sell in May or late April event just like we did last year and recent years as the Sell in May and Go Away Statistics play out once again.  The 3rd table shows our Sell in May and go Away Statistics.


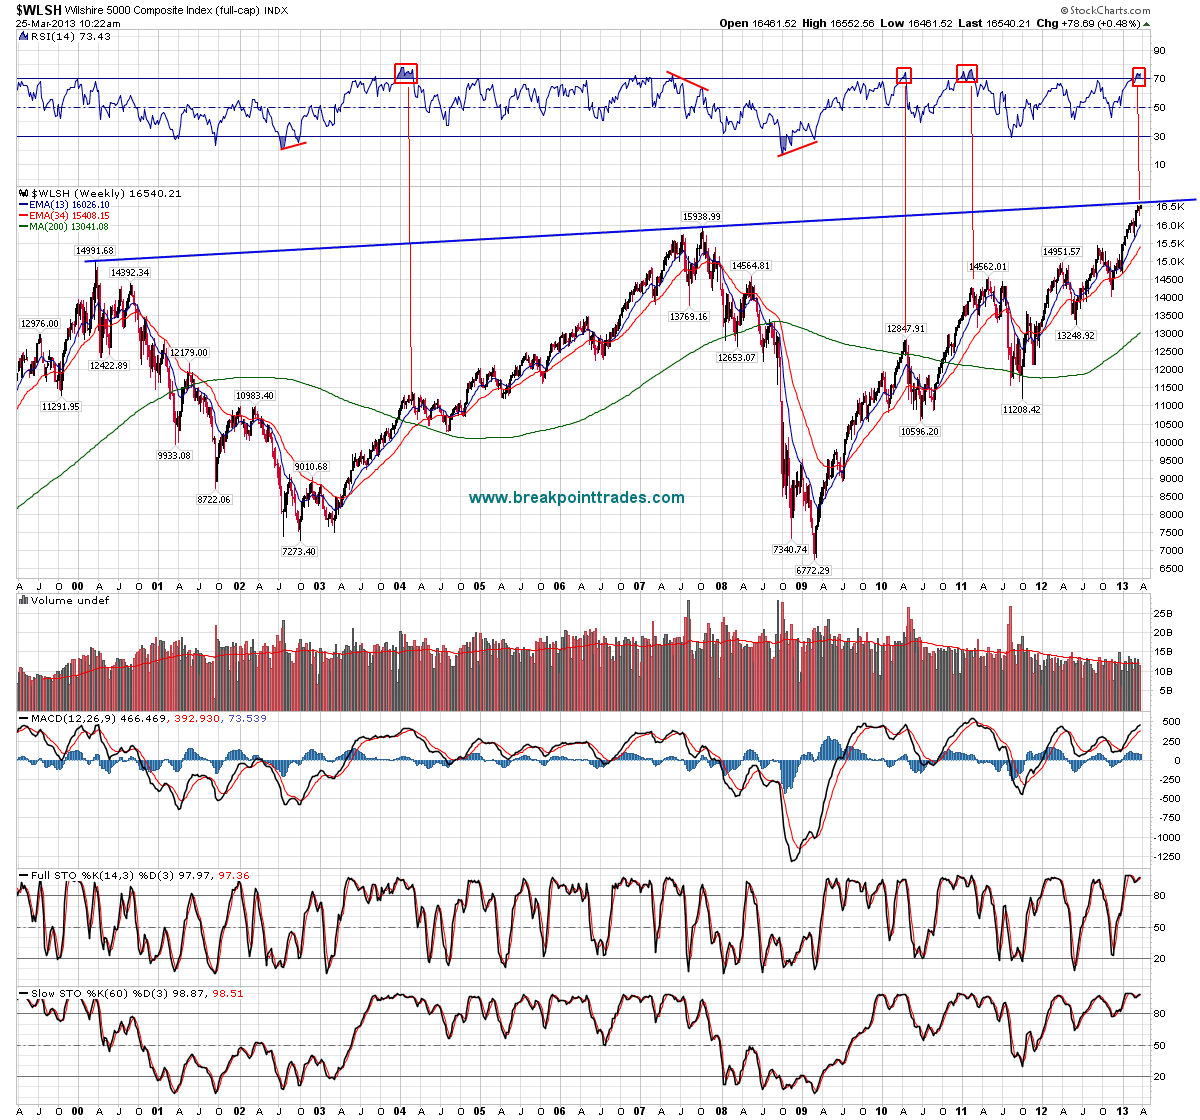
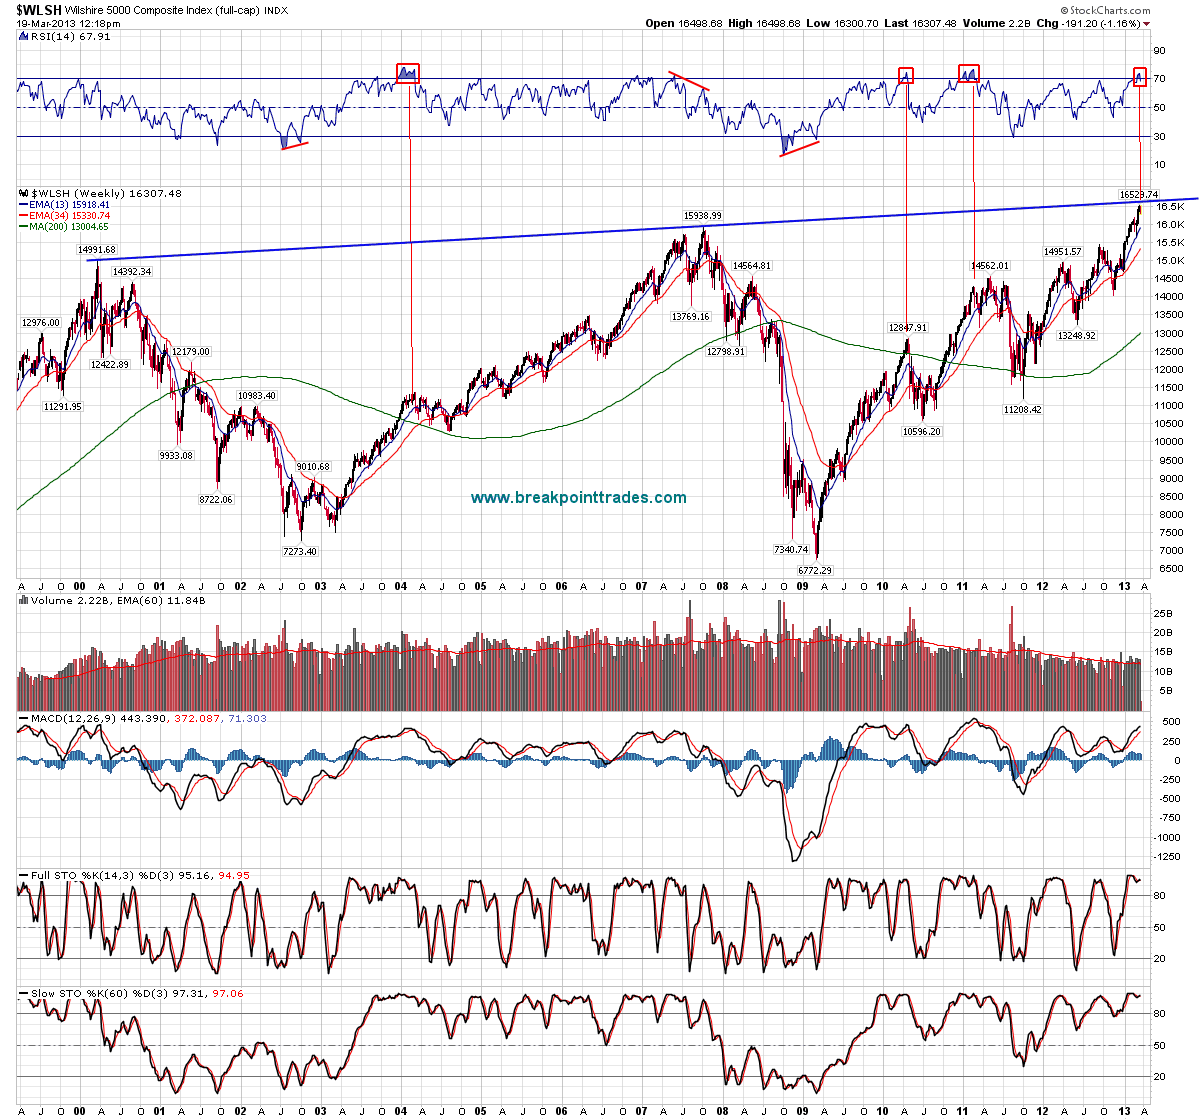
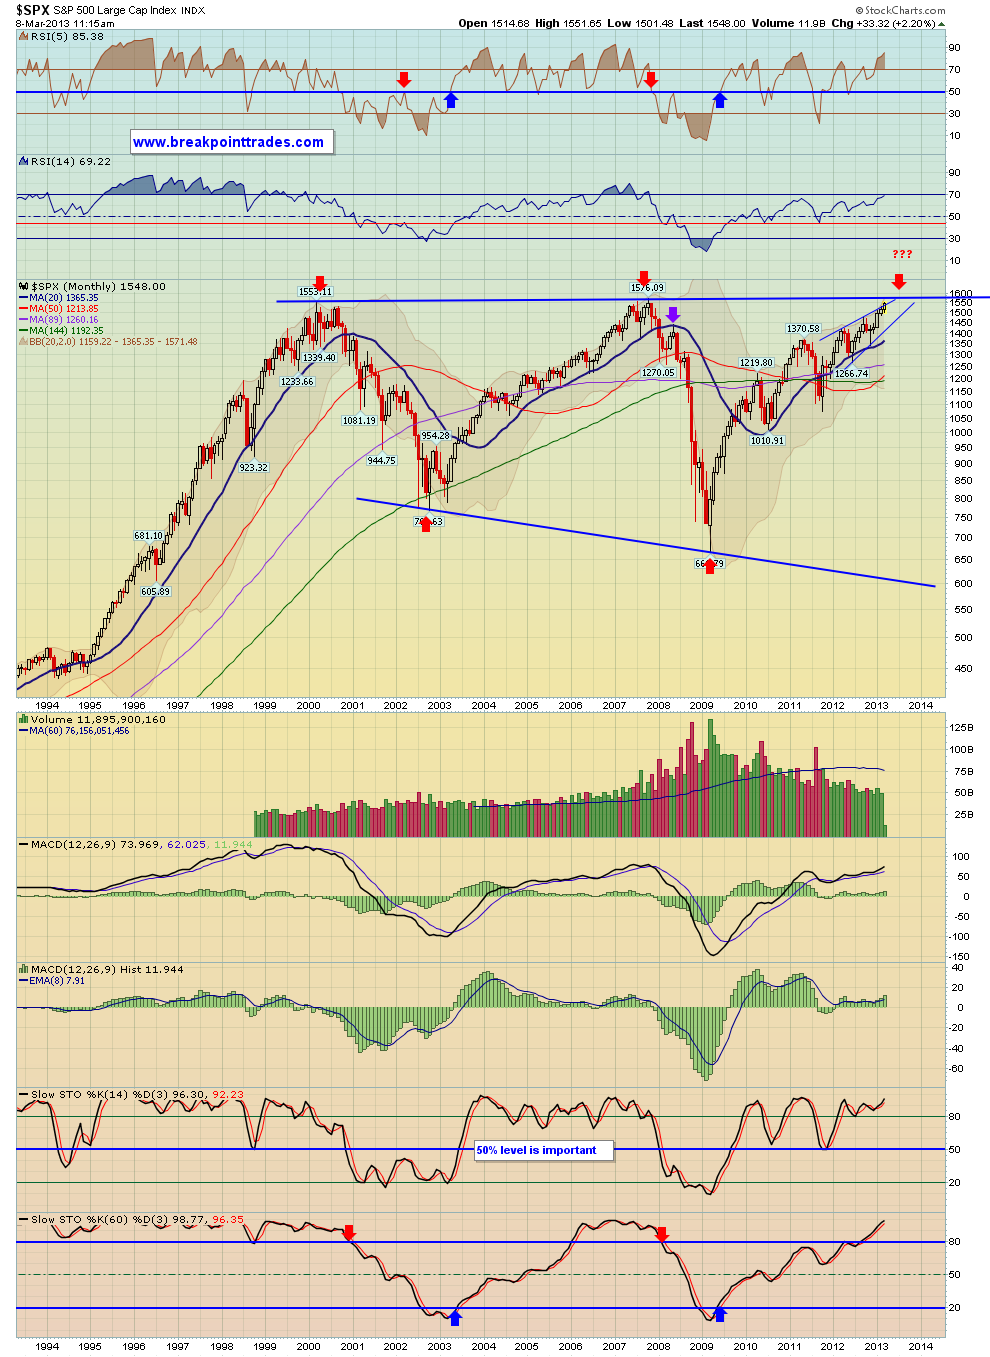
Currently it appears the that S&P 500 is attempting to form a H&S top just like it did last year, here's our fractal chart - currently working on the head (chart 4).  We are also very close to all time highs on the S&P 500 and the Wilshire 5000 is nearing it's upper 13 year trendline (chart 5). However in the short term once the head of this H&S completes I would expect an initial sell off and then another bounce to form a lower high in April.


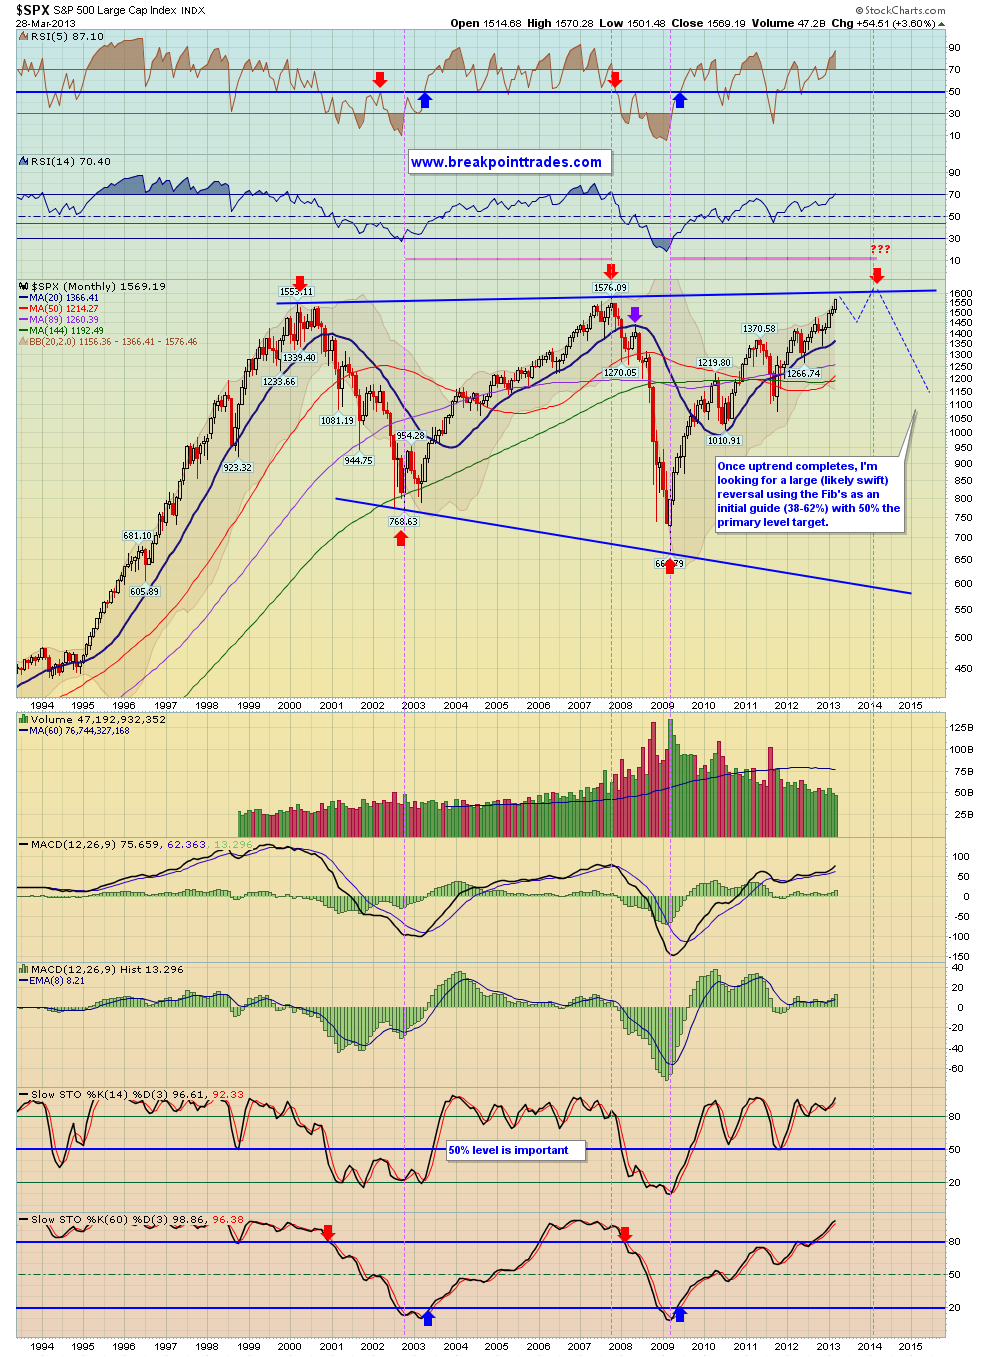
I think this year the market will experience another sell off like last year, then chop around in the summer time frame, and have another rally end of year.  Then I think 2014 will begin another bear market that retraces 50 - 62% of this current cyclical bull market - the last chart shows the monthly SPX chart

Tuesday, March 26, 2013

Itch that needs to be scratched

As you know it was another good day for the market, however as I have been showing, the all time high on the SPX is so close now, it's almost like an itch that needs to be scratched


here's two weekly charts of the S&P 500 and the Wilshire 5000 index

Gold stocks continue to be weak

As the general market strengthens and the S&P 500 nears its all time highs at 1576, gold stocks continue to struggle.  


Here's a daily chart of the HUI Gold Bugs Index, notice the bear wedge pattern which I have been showing since Monday of last week.I'm not surprised to see weakness in gold stocks, however my question is, does the HUI make one more new low or simply retrace some of this wedge and form a higher low?


The second chart shows a daily chart of the GDX ETF, notice that it logically stopped at the May 2012 lows, remember in technical analysis broken support becomes resistance.  

Monday, March 25, 2013

Mar 25th Market Newsletter

Here's our most recent newsletter which briefly covers the general market, commodities, and trade ideas


CLICK HERE to view the newsletter


Matthew Frailey

Short term and Big Picture Market Thoughts


Here's two weekly charts, one for the S&P 500 and one for the Wilshire 5000.  As you can see, the S&P is very close to its all time highs, why not test them.  Also the Wilshire 5000 is very close to the upper trendline which connects the 2000 and 2007 highs.


Short term these indexes may want to tag these areas or get very close to them, however then I'll think we'll get a decent pullback and sell off in April and May in the Sell in May effect as the RSI indicators are sky high. 


However I don't think the ultimate TOP will be in place, I think the market will then chop around in the summer time frame, then go and make new highs again in the fall and end of year, however I think think that a bear market will begin in 2014 that will last 1.5 - 2 years and retrace 50% to 62% of the bull market move - see the last chart


APPL follow up

AAPL - Chart Link - AAPL has continued to follow through from the divergent daily low, the 50 MA has now been taken out and the downtrend line


AAPL - Chart Link


AAPL - Chart Link

Thursday, March 21, 2013

NDX weekly - possible H&S top setting up

$NDX - Chart Link - possible H&S top setting up on the weekly chart of the Nasdaq 100.  Clearly AAPL weighs heavily on this index, however the pattern is something to take note of

Gold, Silver stocks

Here's some of the gold/silver charts I had in the weekend newsletter that, I've also included daily and 60 min charts, note that a lot of the 60 min charts have potential inverse H&S patterns.  Also keep an eye on the ratio trendlines (watch the video below) 


Also Here's a short video on using the Ratio as a tool for trading the PM stocks


click here to watch the video

Wednesday, March 20, 2013

Here\'s our most recent newsletter


Here's our most recent newsletter, however just a word of warning, it's quite detailed and 40 min long, but it provides a good education


Click Here to view the newsletter


Tuesday, March 19, 2013

Wilshire 5000 index

Here's a weekly chart, getting dangerously close to that upper trendline with the RSI overbought as well

Sunday, March 17, 2013

Precious Metals Newsletter March 17th, 2013


Hello everyone, here's my commodity newsletter, this one really only talks about Precious metals with a big focus on the individual stock setups


You can view the newsletter here


Best to your week! Matthew Frailey


Friday, March 15, 2013

TZA 60 min bull wedge forming

TZA - Chart Link - as you know, the SPX missed the all time closing high by a few points.  Here's a 60 min chart of TZA, the -3X ETF for the Russell 2000.  It has a bull wedge appearance that may provide an initial trade on a quick market pullback.

Tuesday, March 12, 2013

Quick video on market tops and bottoms

One of you below asked "when is the bottom gonna fall out of this market"


therefore in response to this, I made this quick 3 1/2 min video which I think provides a good education


http://breakpointtrades.com/jing/2013-03-12_1403.swf

Our Recent Market Newsletter

Hello folks, the energizer bunny crack fueled market continues!  Here's my recent newsletter which discusses the market, as well as GDX, DBA, and some trade ideas


Click Here to View Our Market Newsletter


have a great week! Matthew Frailey

Monday, March 11, 2013

5 consecutive closes outside upper Bollinger Band for the Dow Jones

Today the Dow Jones closed outside the upper Bollinger Band 5 days in a row, this has only occurred once ni the last decade, so obviously it is quite rare. Credit: Ryan Detrick

Sunday, March 10, 2013

NEM weekly chart and RSI

Here's a weekly chart of NEM that I first posted back in 5/17/2012 of last year (click here to see my previous post) when the 14 length RSI became oversold below 30%.  As you can see via this 20 year chart, whenever the weekly 14 length RSI became oversold on NEM, it was only a matter of time before some kind of bounce occurred.  


As you can see from the chart, sometimes it signaled a major bottom, and sometime it simply produced just a bounce in a downtrend, however some kind of tradeable bounce always occurred. 


Currently the weekly 14 RSI is now slightly below 30%, which is technically oversold. Let's see if some sort of bounce will begin soon.

Friday, March 8, 2013

Short term market views

Below I posted some longer term views on the market, here are some shorter term views:


The first chart show our 30 min S&P 500 chart which we showed last week as an inverse H&S pattern - clearly this is playing out perfectly and appears to be subdividing into a wave 5 structure, once wave 5 is complete, then I would expect some kind of pullback/correction in the market.


the second chart shows a daily view of the S&P 500 - this chart shows a fractal and how the SPX may be in the process of forming a Head of a H&S pattern which is VERY SIMILAR to last year!  I would then expect a similar pullback once it is complete


The 3rd chart shows another view of the H&S pattern that is in the early stages of formation, the left shoulder is in place and the head is now forming. Once the head is complete, I'd expect a pullback (which will get the bears exited) however then I would expect one more rally and push higher, however it should form a lower high, which will form the Right Shoulder of the H&S pattern - then finally the market will be set up for a larger pullback.  It will the Right Shoulder where traders should look to aggressive short the market.


take care and have a great weekend folks!!


Matthew Frailey

S&P 500 daily and weekly views and follow up

I haven't commented on the market lately here on our public blog, however things are pretty much lining up like we projected!  The first chart here shows a daily S&P 500, last year in December we showed this inverse H&S pattern (in green) which projected to about 1550 on the SPX - well the S&P hit that target today!!


The second chart shows a monthly chart of the S&P, this is one I posted a while back as well - honestly I don't see how the SPX won't eventually test the upper long term trendline going back to 2000.  


Otherwise shorter term, our thoughts are that the market is carving out a head to a H&S top for a sell off in April or May as the 'Sell in May and go away' will likely play out again this year.  however after some summer chop and consolidation, I would expect the market to then do well in the fall and end of year.  Then perhaps a bear market finally begins next year?  

Thursday, March 7, 2013

Thoughts on Gold stocks

As I promised earlier, here's some additional thoughts about the recent action and some comparison to past action - there seems to be a lot of emotion with some of you gold bugs so I thought it was important to go over this again in more detail


http://breakpointtrades.com/market_analysis/legacy.php?nl_id=1461

GDX - Chart Link - I keep getting pm questions about ...

GDX - Chart Link - I keep getting pm questions about GDX, but honestly there is nothing new to say that I didn't say this morning.  First of GDX stopped at the downtrend line (in black), that's resistance on the daily chart


GDX - Chart Link - the 60 min chart broke out of the wedge, I think the pullback is OK and could form a higher low, I want to see it stay above the broken downtrend line


GDX - Chart Link - 15 min view, stopped cold at the 61.8% Fib and has now retraced about 50% of yesterday's move

Wednesday, March 6, 2013

Wednesday Mar 6th, 2013 Newsletter


Hello everyone, normally I don't send you
too many intra week newsletters, however gold stocks finally rallied
today and I think they could be at a decent tradeable bottom, therefore I
discuss them quite extensively - I think you can get some follow
through for swing trades


click here to listen to the newsletter


Gold Stocks bounced today - VERY oversold

Here's a weekly chart of the HUI gold bugs index, first off notice that price tested the 61.8% Fib.  Also take a look at the weekly 14 length RSI, it is the most oversold since 2008.  Prior to this the only time it was more oversold was in 2000.

Tuesday, March 5, 2013

There are old traders and there are bold traders.....

But there are no old, bold traders!


A tale of a 33 year old trading "whiz" that lost $400k of his own dough, and $10million of investor money.  Crazy story -- he ONLY traded AAPL!


http://tech.fortune.cnn.com/2013/03/04/apple-zaky-bullish-cross/

Money flow


 It is also important to note that broad market money flow has not kept pace
with recent price appreciation. Please observe the chart below.


The orange circles on the chart above highlight the latest comparison of the
S&P 500 Index (SPY) to our proprietary measure of broad market money
flow (MF). The arrows illustrate the inverse direction one has to the
other. This is further indication that a pullback in stocks is forthcoming as
MF leads price.


Monday, March 4, 2013

GDX RSI 2 oversold reversion to the mean follow up

As you know GDX has been quite horrid.  2 weeks ago the RSI 2 oversold system went long as the RSI closed below 2%.  The system had a quick but winning trade as price bounced back to the mean - which was nice because GDX then sold of hard and has made new lows.  However the system is actually very close to taking another long position because today the RSI 2 closed at 3.26%, and if GDX had another good down today tomorrow, the RSI will likely close at 2% or below, which would cause the system to go long again.

Sunday, March 3, 2013

Weekend Newsletter Mar 3rd, 2013


First off I hope everyone had a nice weekend!


Here's my weekend General Market Newsletter,
I cover the general market and my thoughts, however this newsletter is
longer than normal because per request I go over my Long Term views on
the market in an educational manner - please take the time to revew


You can view the newsletter here.


Matthew Frailey