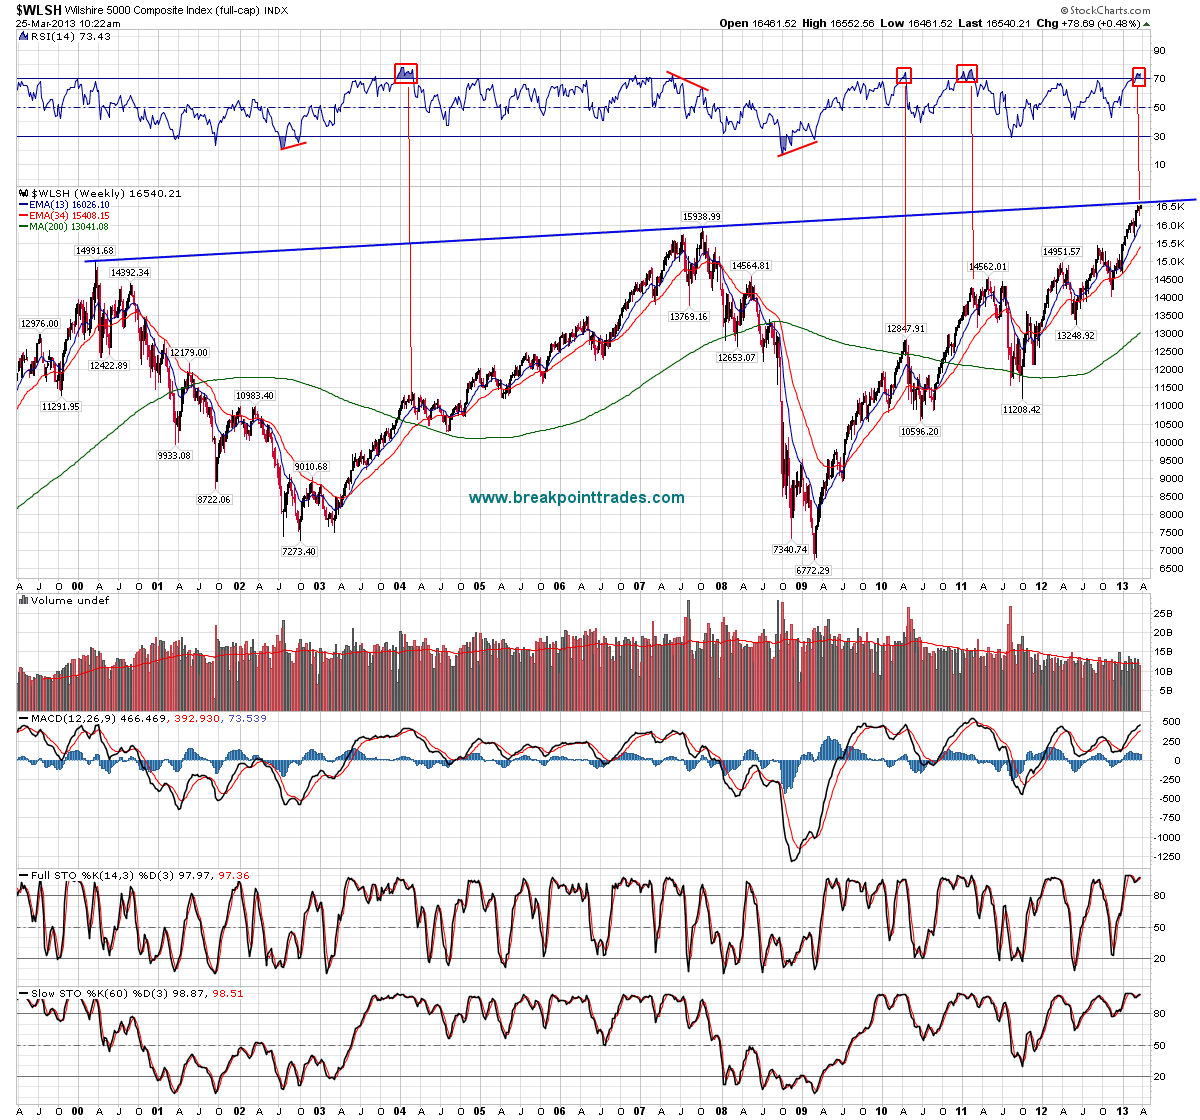
Here's two weekly charts, one for the S&P 500 and one for the Wilshire 5000. As you can see, the S&P is very close to its all time highs, why not test them. Also the Wilshire 5000 is very close to the upper trendline which connects the 2000 and 2007 highs.
Short term these indexes may want to tag these areas or get very close to them, however then I'll think we'll get a decent pullback and sell off in April and May in the Sell in May effect as the RSI indicators are sky high.
However I don't think the ultimate TOP will be in place, I think the market will then chop around in the summer time frame, then go and make new highs again in the fall and end of year, however I think think that a bear market will begin in 2014 that will last 1.5 - 2 years and retrace 50% to 62% of the bull market move - see the last chart


No comments:
Post a Comment