Friday, July 31, 2015
Thursday, July 30, 2015

Monday, July 27, 2015
General Market and Commodity Weekend Newsletters- Free
Hello everyone, here's our very comprehensive free market newsletters, one for the general market and one for commodities. Make sure to look at these when you have time as I discuss the bigger picture and my thoughts/concerns for this year:
- Click here to view the General Market Newsletter
- Click here to view the Commodities Newsletter
I had posted this on our Twitter account last night, make sure to follow us
enjoy the rest of your day!
Matthew Frailey

Wednesday, July 22, 2015
Triple Tops or Triple Breakouts? Don't see this often!
Article by Chris Kimble:
http://blog.kimblechartingsolutions.com/2015/07/triple-tops-or-triple-breakouts-dont-see-this-often/


http://blog.kimblechartingsolutions.com/2015/07/triple-tops-or-triple-breakouts-dont-see-this-often/
I shared this chart with members last week, taking a long-term look at one index in the states and one from Europe, that both look a ton alike!
This 2-packs at the Valu-Line Geometric index and the FTSE-100 from London. Both hit highs in 2000 and then proceeded to fall around 50% each in the 2002-2003 window. Then they rallied back into the 2007 time frame, reaching the 2000 levels, where the both peaked again, followed by another 50% decline.
Since the 2009 lows, each has rallied back and each is now testing the 2000/2007 highs again.
To me, this is a good example of correlation these days on a global basis, reflecting that correlation is pretty darn high. The challenge with correlation these days is…say we own 100 stocks or numerous indices around the world, thinking we are diversified. If they all move together, do we have a diversified portfolio or basically one giant holding?
Humbly I believe we live in risky times, not due to the chart above though. The high degree of correlation raises risks for all of us.
Will it be different the third time and each breaks resistance? Sure could as the trend is up and each are above long-term moving averages. Should a breakout take place here by one of them, the other could follow along with other key indices that have been stuck at breakout levels since the first of this year!
Few investors are bullish at this time and if a breakout would happen, it would catch a good percentage of investors by surprise. This chart from Ryan Detrick reflects AAII bullish levels that were last hit at the 2003 & 2009 market lows.

The stock/bond ratio also finds itself at key breakout/resistance test levels at the same time!

Several markets from around the world have paused at key price levels, so far acting as resistance. How they handle this could tell us a ton about where markets will be at the end of this year!


Monday, July 20, 2015
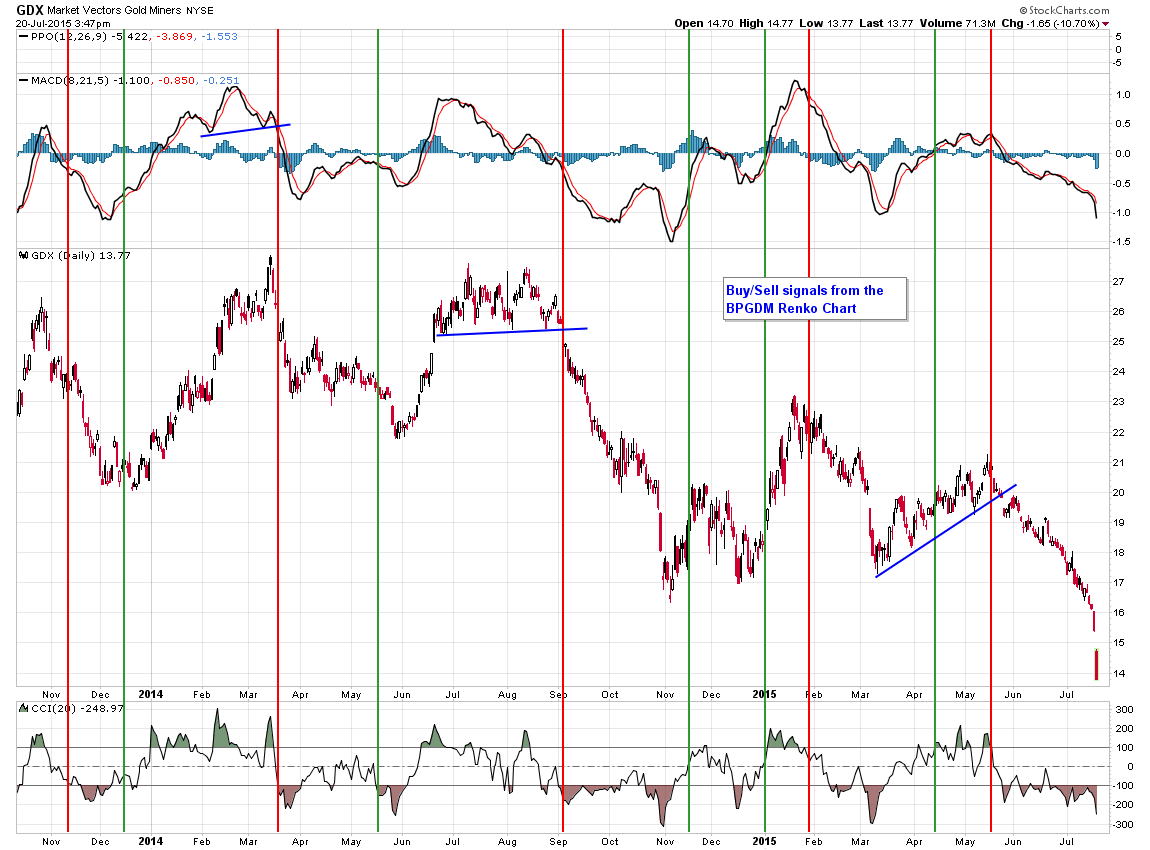
GDX BPGDM system stats update
with the absolute carnage in this sector the system trade from the BGPDM renko system is up 33.6%, crazy


Friday, July 17, 2015


Wednesday, July 15, 2015

Tuesday, July 14, 2015
From A Member- Chris Kimble: Life could get cheaper if these break support
Life could get cheaper if these break support!
A Big Picture signal could be coming from products most of use on a daily basis!
The 4-pack below looks at Crude Oil, Coffee, Copper and Cattle.
 CLICK
CLICK
Crude Oil broke below a support line that had been in place for the past 7-years. Of late it kissed the underside of this new resistance line and has been soft since.
Coffee’s weakness over the past 9-months has it testing a support line dating back to the lows in 2001.
Copper is attempting to break a 10-year support line.
Cattle is on a support line dating back to the lows in 2009.
Support is support until broken! If support would give way for each of these, the price message from billions of free thinking people could be an important macro message and it could be sending a macro message to the stock markets.
Stay tuned to see if these important commodities can hold at support!
Monday, July 13, 2015
Weekend General Market and Commodity Newsletters, July 12, 2015- free
Hope everyone had a nice weekend! Here's my free commodities weekend newsletter, click on URL below
Also, here's my newsletter with my in-depth review of the general market, click on URL below
Subscribe to:
Posts (Atom)