Hello everyone, here's tonight's newsletters, as always I cover the general market and a few commodities, however the vast majority of the newsletter is spent on trade ideas, so please check them out!
best to your week!
Matthew Frailey
Hello everyone, here's tonight's newsletters, as always I cover the general market and a few commodities, however the vast majority of the newsletter is spent on trade ideas, so please check them out!
best to your week!
Matthew Frailey
Just got through looking through 1000 charts, here's a bunch of trade ideas
since I have so many trade ideas this evening, I'll keep the rest of the newsletter short


$SPX - Chart Link - nice pop on that pennant via the 5 min chart
$SPX - Chart Link - 60 min chart shows an inverse H&S pattern, perhaps this can play out, however too early to tell.
$SPX - Chart Link - however remember that a good move up might only be a wave C, we'll see...


IWM - Chart Link - to along with the Russell 2000 chart below, you can see this perfect kiss of the downtrend line which occurred yesterday, provided a low risk short

As you know the market rebounded off the lows a couple weeks ago, which was logical given the fact that several of our market breadth indicators like the NYMO, NAMO, RHCOMPQ, NYLOW were at extreme levels (see my prior posts from below to see these indicators). Now that the market has bounced, it went too far too quickly and looks like it may want to pull in some here.
The first chart shows a daily chart of the Russell 2000, we showed this to members yesterday, notice how the candlestick exactly tagged the downtrend line, that marked resistance and a low risk short with a tight stop. Now we'll see if price can form a higher low on a pullback or not.
The second chart shows the RHCOMPQ market breadth indicator, which had spiked down to 5% two weeks ago, and subsequently the market bounced afterwards. However notice that many times this indicator has two spike lows before a good bottom is in (not always but many times it does). If this were to occur again, then expect another market pullback to form either a higher low or a lower low.
Again the easy long trade was 2 weeks ago when the indicators were at extreme levels, now we'll see where this pullback takes us, stay tuned...


Late last week on Thursday and Friday I posted charts of the NYLOW and NAMO and NYMO market breadth indicators, which had spiked to levels generally associated with some kind of tradeable bottom - as you know so far we've had a nice rally off the lows, especially on Monday.
The first chart below shows the NYLOW indicator, as of Thur/Fri last week it had a large spike up, which as you can see generally marketed at least a short term tradeable bottom - basically the rubber band got too stretched and was due to snap back, or a reversion to the mean.
The second chart below is a daily S&P 500 chart, last Friday the S&P 500 closed well off the lows to form a hammer reversal candlestick and note that it logically occurred right off the 61.8% Fibonacci retracement. The next major resistance for the S&P 500 is the 20 day MA and of course the think blue horizontal line between 1403 - 1405, this is an area to watch for a potential pullback again.
The third chart is a 60 min SPX chart, note the bull wedge that had formed at Friday's lows last week - next resistance are the Fibs and the downtrend lines.
And lastly the 4th chart shows a 15 min chart of the S&P 500, if the market has put in a low, one bullish pattern that could set up is an inverse H&S pattern, currently the RS is developing, but still too early to say for sure and anything goes at this point.
Otherwise congrats to anyone who went long Thur or Friday last week for a tradeable bounce!
If you like our charts and analysis, please consider signing up to our website, also ask about our 25% coupon end of year special!!
Happy Thanksgiving!!
BPT


$NYLOW - Chart Link - Obviously a nice bounce in the market, but again these indicators were at extreme levels late last week, as you can see from the NYLOW here, so should not be a surprise
$NAMO - Chart Link - NAMO and NYMO with Bollinger Bands

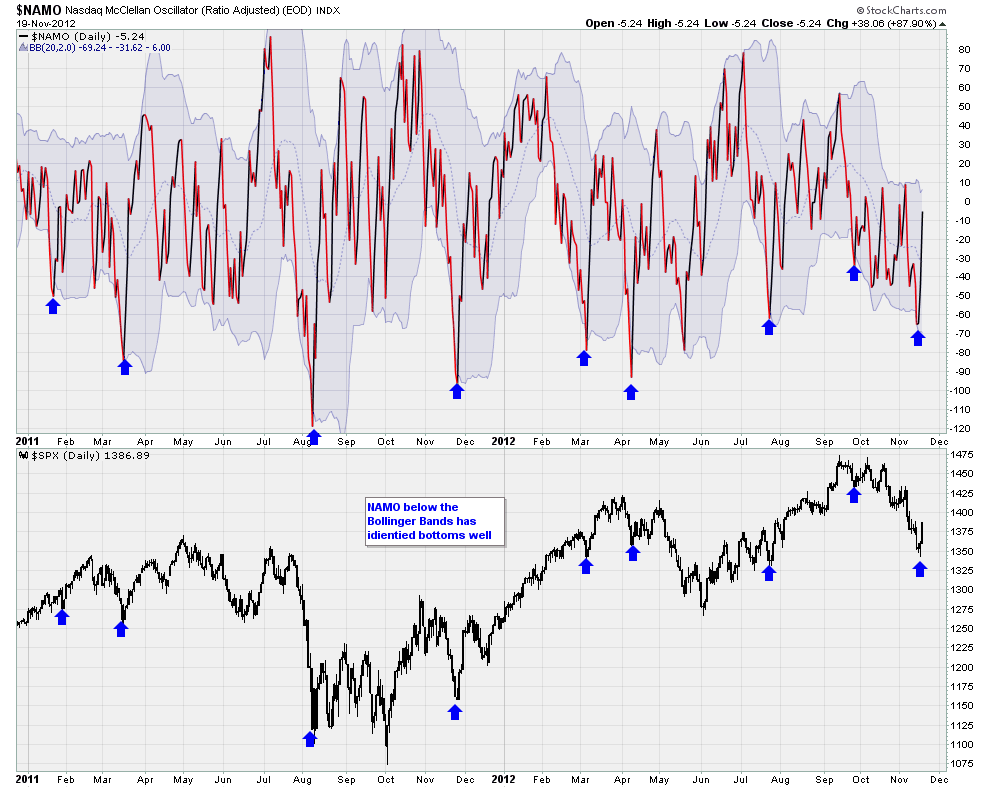

This indicator is spiking and getting to levels where the market has bounced from in the past

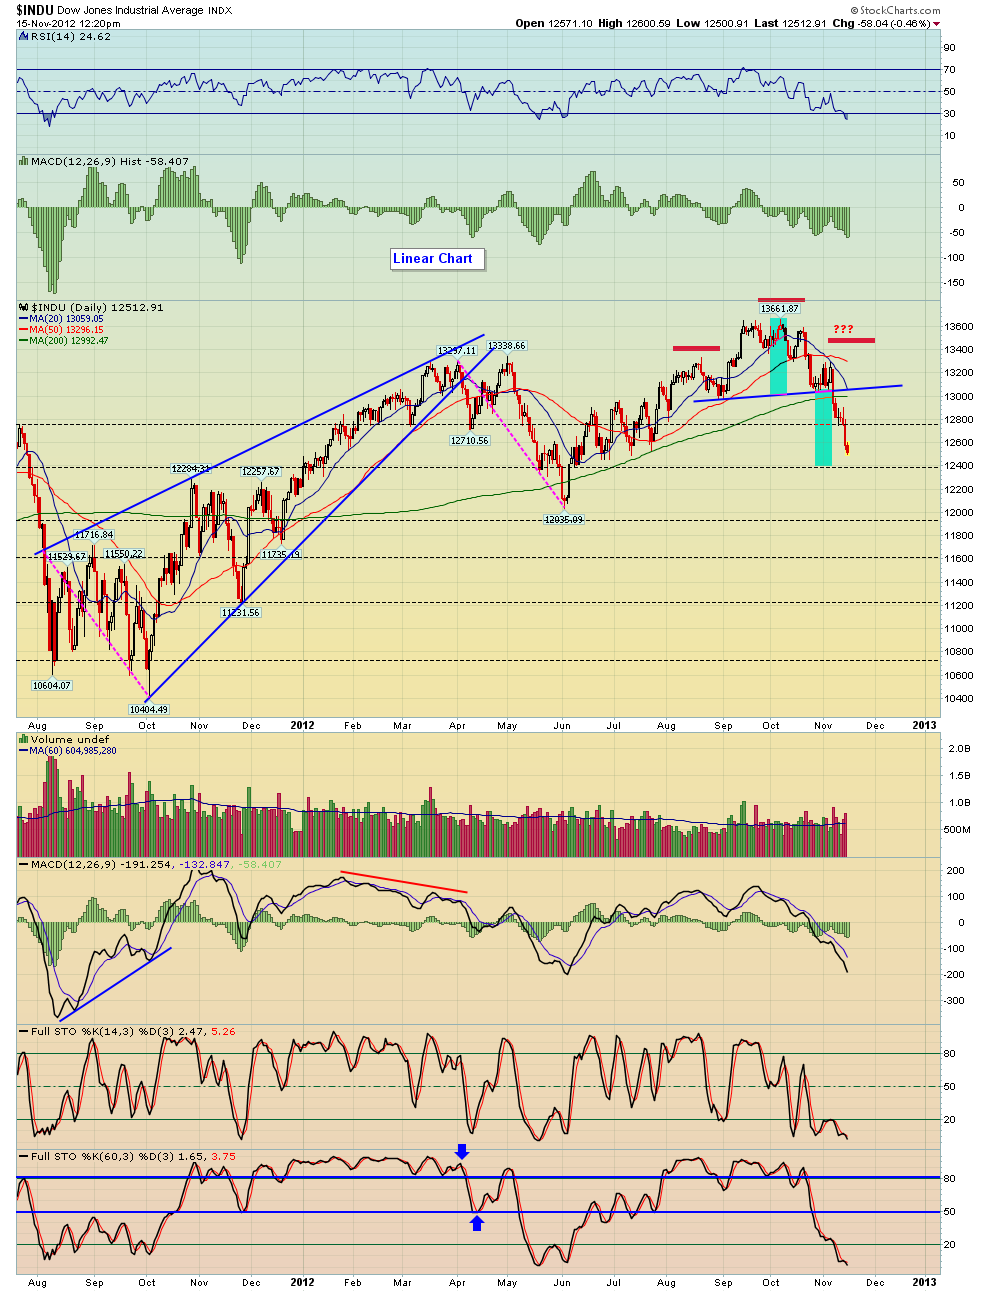
The H&S pattern on the Dow is finally getting closer to its target area
The S&P 500 has now retraced to the 61.8% Fibonacci retracement

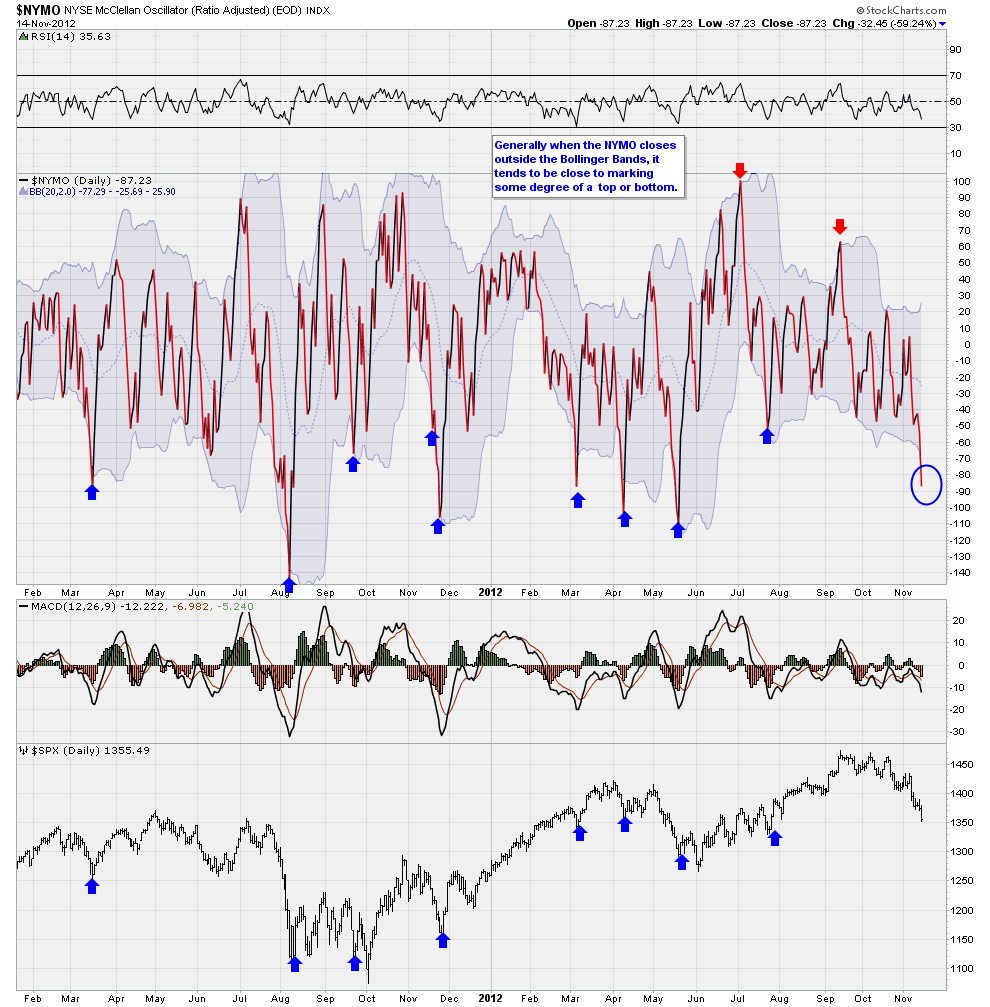
$NYMO - Chart Link - Here's a longer view of the NYMO, last night I showed the NYMO with Bollinger Bands, this one goes further back without BB's, instead uses the -80 level - gives you a visual of how this current spike down is in relation to previous spike lows, clearly it's low right now, but as you can see many times on deep pullbacks it goes quite a bit lower


$NYMO - Chart Link - price spiked below the Bollinger Bands on both the NYMO and NAMO, so it's something to take note of as spikes below the Bollinger Bands can sometimes market short term or tradeable bottoms.
However these can be early and clearly the market index charts still do not look good, just pointing out these indicators for now as we are getting oversold in the short term.

Here's a post I made back in Dec 2008 (the wild days)
http://breakpointtrades.com/blog/post/40089/
Time Tested Classic Trading Rules
for the Modern Trader to Live By
This is a list of classic trading rules that was given to me while on the trading floor in 1984. A senior trader collected these rules from classic trading literature throughout the twentieth century. They obviously withstand the age-old test of time.
I'm sure most everybody knows these truisms in their hearts, but this list is nicely edited and makes a good read.
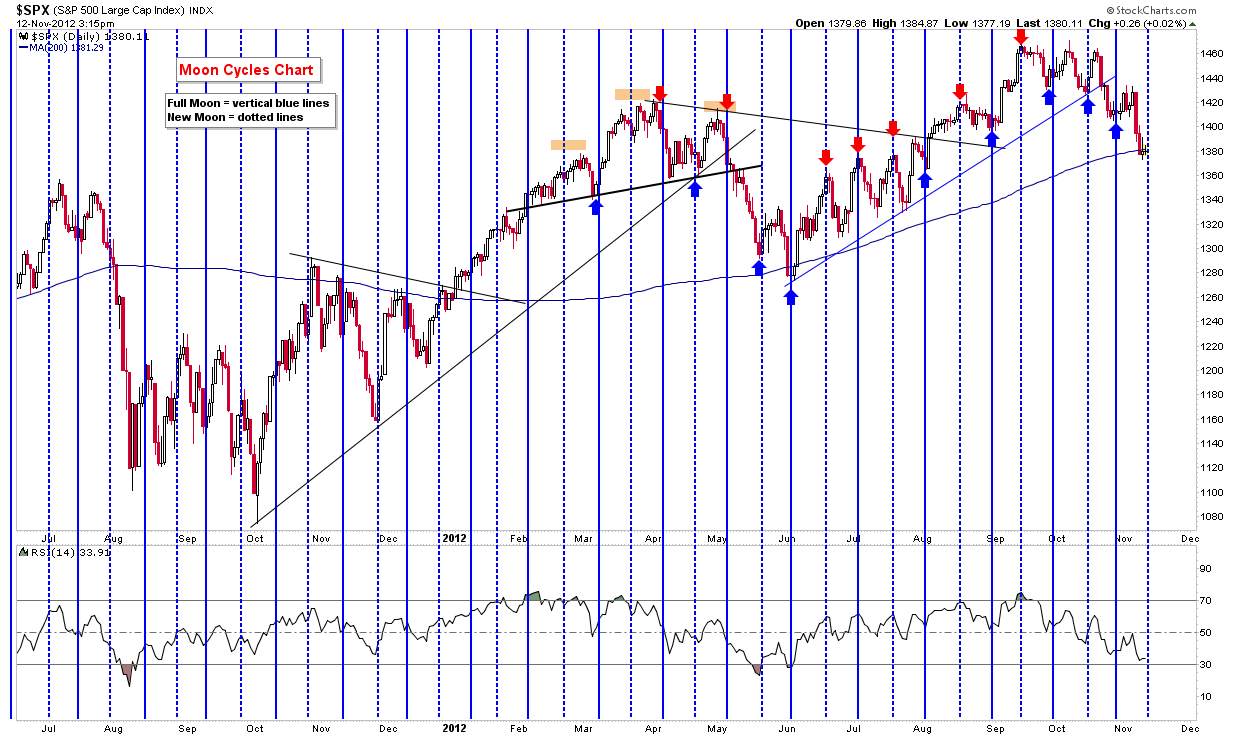
Tomorrow is the New Moon cycle, lately the market has at least responded to the cycles for at least a temporary bottom, we'll see if this one produces a bounce. Remember that the cycles are +/- a day or so
The RSI 2 BPT system will go long today if the SPX closes down but remains over the long term 160 SMA. Below the 160 SMA the system doesn't take longs.
If the market closes down today, the EMA based RSI 2 will have been oversold for 2 days in a row, which is a requirement for the system - but again price must stay above the 160 SMA, which is currently at 1386, but can of course change sightly by the close
This system scales in for a potential of 4 entries of 30%, 30%, 20%, 20%, today's entry would be 30% if it occurs.
Remember that there are two versions to this reversion to the mean system, one that closes out when RSI is overbought or oversold, and one trending version that at times will attempt to hold a trade longer when conditions apply. Here are statistic reports for each version of the system
(click below the report will open ONLY in I.E. Internet Explorer as an MHTML performance report file)
Rules: goes long when price is above the 160 SMA when EMA based RSI closes below 11% for 2 days in a row. exits when RSI 2 closes at 80% or higher
Shorts - reverse, when price is below 200 SMA, shorts when RSI 2 closes above 90% for 2 days in a row, exits on a close below 40%
System scales in 4 potential entries of 30%, 30%, 20%, 20%, but each successive entry must be at a better price than the previous one i.e. entry 2 has to be better than entry 1, entry 3 has to be better than entry 2 etc.
This is a reversion to the mean system as it is only in the market 12.4% of the time
(click below the report will open ONLY in I.E. Internet Explorer as an MHTML performance report file)
EMA RSI 2 system - trending certain times
Rules: The same as the non trending system, except this system will attempt to hold trades longer at certain times - however this is still a reversion to the mean system, it's only in the market 19% of the time, the rest of the time is in cash - while the non trending system above is in the market only 12.36% of the time.
As always this is provided as information only, trade according to your plan and risk tolerance

Hello everyone, here's my most recent Newsletter, please take the time to review as I discuss both the short term and longer term picture of the market, as well as commodities.
Also on an Administrative note, be aware that we have a 'new' Newsletter format where you can skip around and play audio for individual charts vs the whole newsletter (see the tabs at the top of the newsletter.
As always, best to your week!
Matthew Frailey
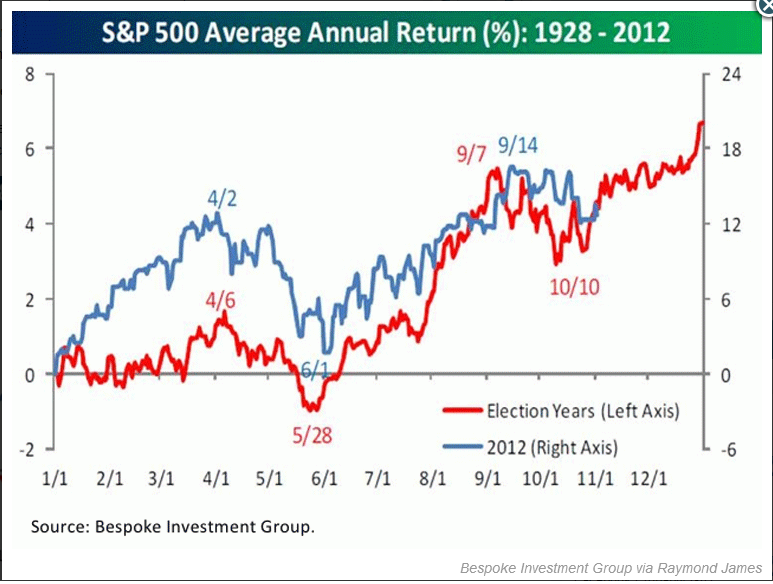
so far the market has tracked the election cycle seasonality average this year quite well (average back to 1928), if it continues market should go higher into year end
Here's the updated RSI 2 strategies - As you know, one RSI strategy closed out on Thursday (the one that only used the RSI 2 getting over bought without the trending indicator), while the one with the trending indicator closed out on Friday's ugly day after the close.
Here are the charts and Statistic reports. The system that uses the trending indicator has a higher profit factor and a higher net gain, while the one that ONLY uses the RSI 2 to exit trades has a lower profit target of 7 vs 9.8 and a lower total profit gained - however it does have a higher win rate winning 85% of the trades vs 83.9% for the trending system
I will be adding these systems to the Mechanical Systems section of the website and plan to send email alerts when they trigger


futures are up about 7, was up more
Regarding the RSI 2 SPX system - again do what you feel is right, you can either take nice profits or hold and wait for the system to reverse, or a combination of both. The system won't exit until its trending indicator goes negative, if I turn off the trending indicator the system would be out. The stats are still nice with it off, I've attached two stat reports one with it on and off: the system with the trending indicator turned off actually has a slightly higher winning % of 85.3% vs 83.9%, while the one with the indicator turned on makes more money - again that's only logical
otherwise do what you feel is right and suits your trading style.


$SPX - Chart Link - once again the market bounced at the moon cycle, otherwise today the Jobs report will be released at 8:30 EST, let's see how they spin those numbers

