Sunday, July 29, 2012

Mega Weekend Newsletter posted


Hello everyone,
first off I hope you had a nice weekend!  Here's this weeks
comprehensive newsletter; however a word of warning, this is a very
comprehensive and detailed newsletter with many charts (over 70 of
them), thus it may take you some time to get through it, but worth it! 


Best to your week! Matthew Frailey


You can view the newsletter here.


Friday, July 27, 2012

RSI systems update

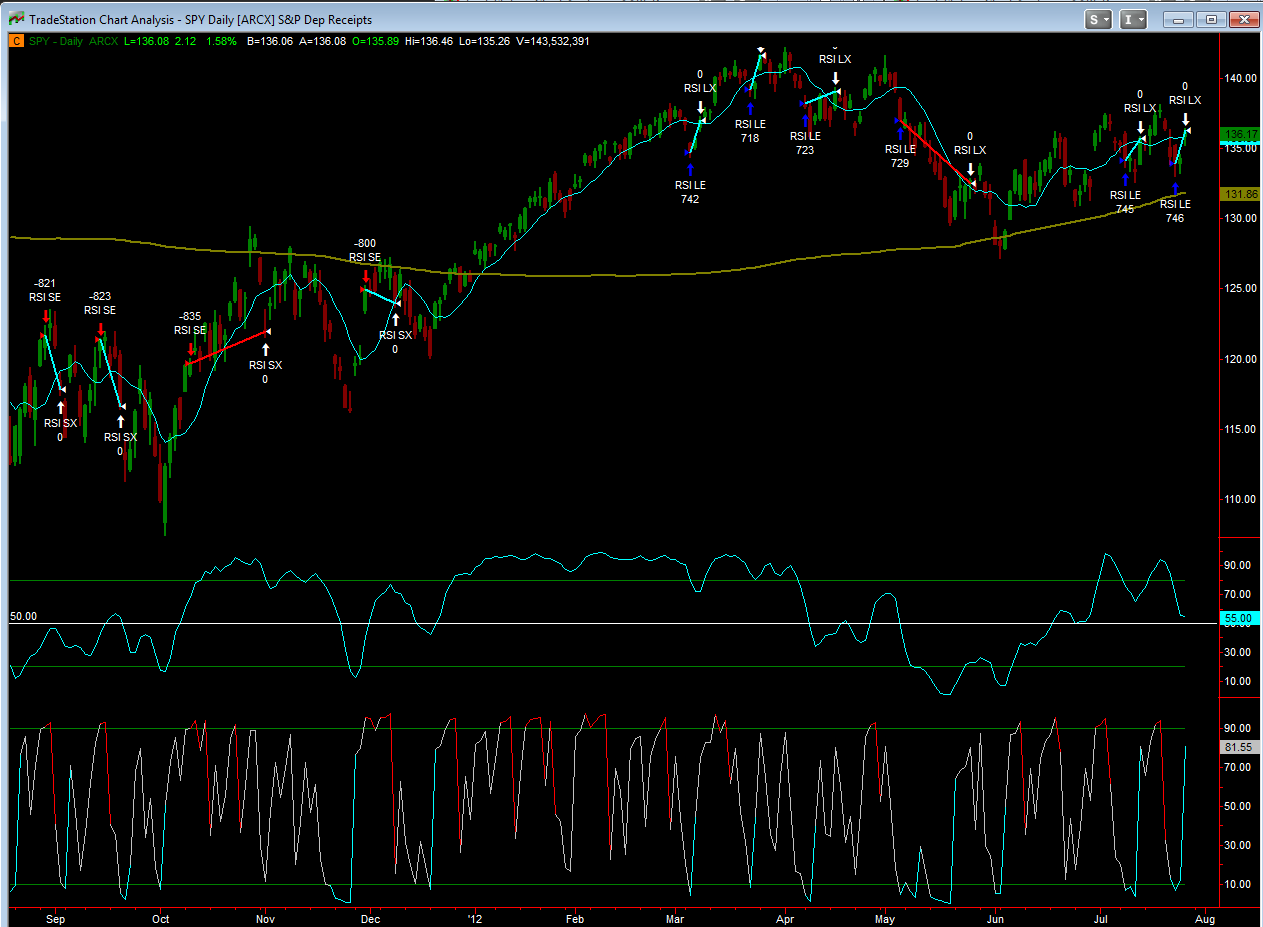
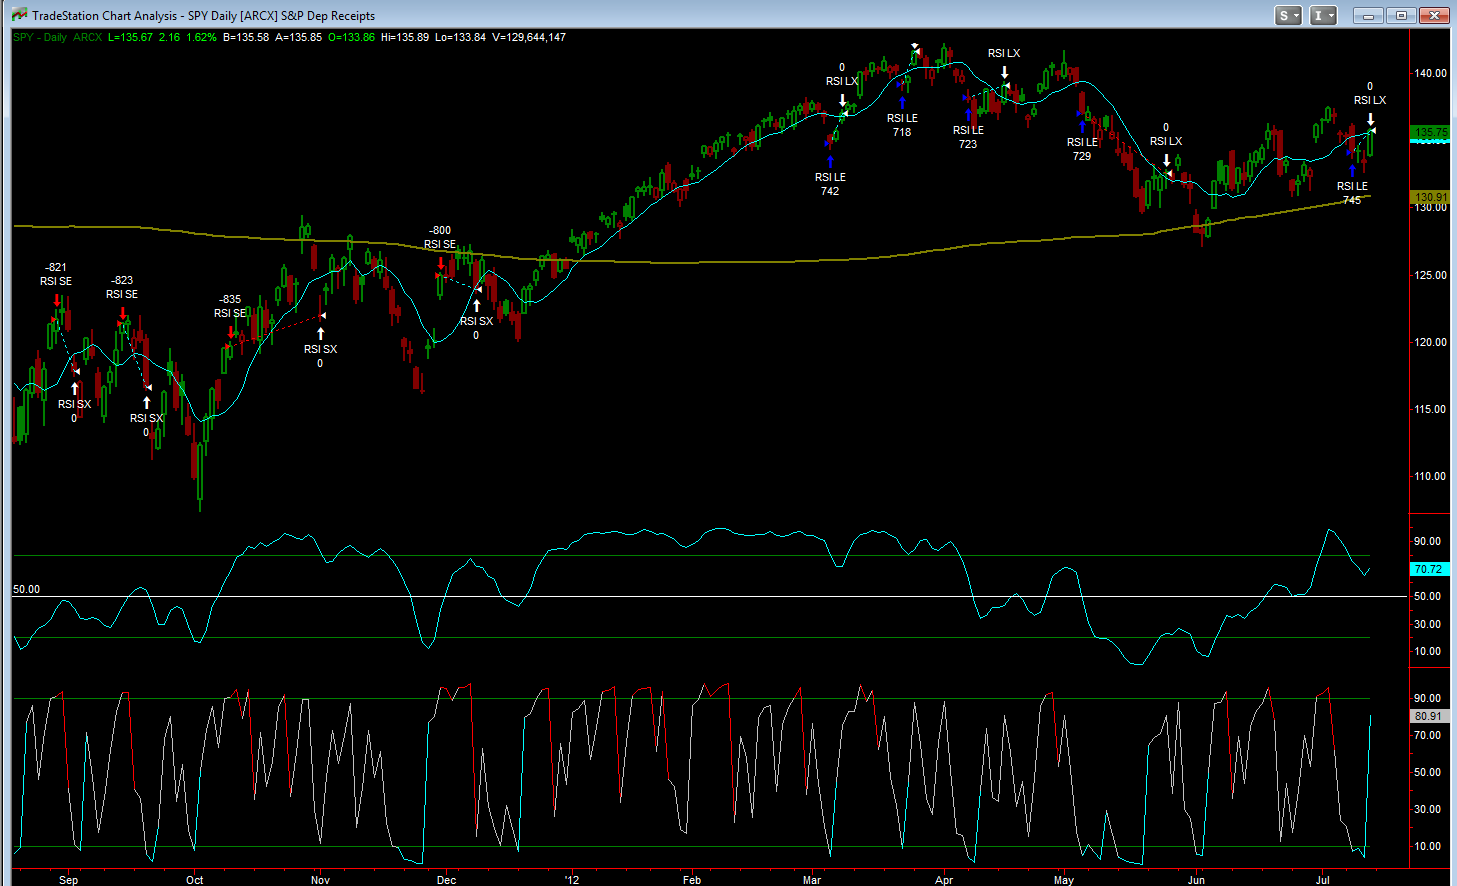
This RSI 2 system closed out of its long today since it closed back over the 9 day SMA


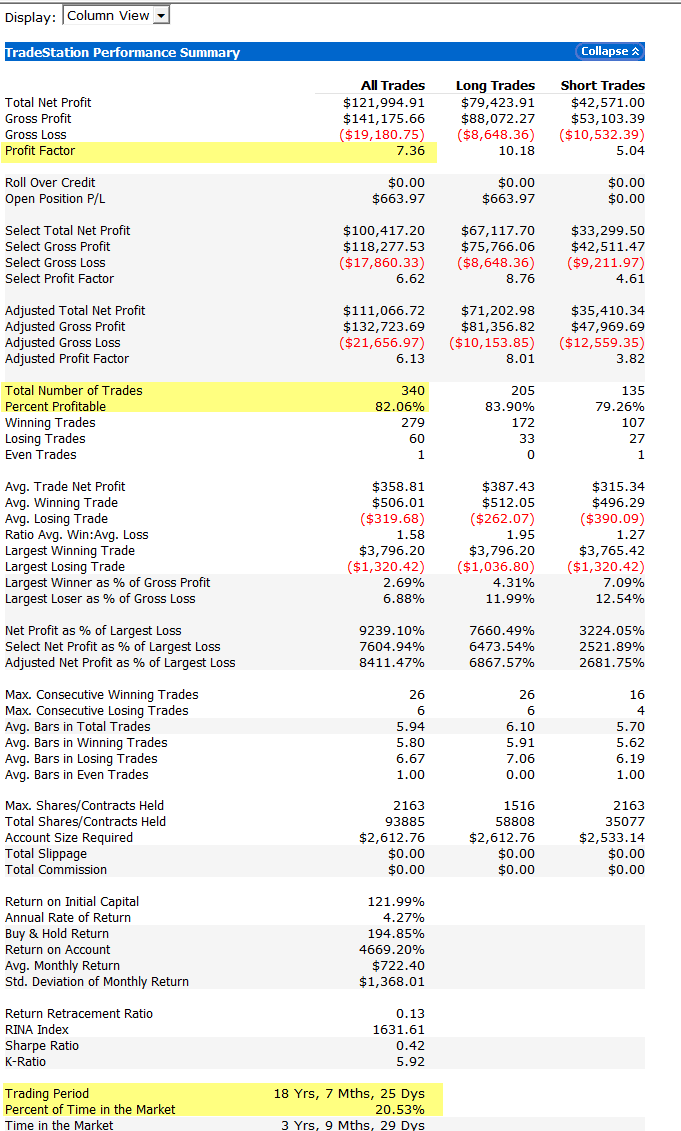
here's the stats: 186 trades over 18 years 8 months.  82% winning trades, PF of 5.2 and a nice profit curve

Thursday, July 26, 2012

Looks like those RSI 2 systems got a good buy ...

Looks like those RSI 2 systems got a good buy on Monday!


however at this time none of them will be closing out.  


One of them closes out when price closes back above the 9 SMA, the other closes out when the RSI closes back over 80%, even with today's big gap, that is not happening

Wednesday, July 25, 2012

BPGDM - Bullish Percent Gold Stock Index

The BPGDM is now at levels not seen since 2008, it's current at 7%, which is an extremely oversold level for a bullish percent chart.  Bullish Percent charts have a range of 0% - 100%, but almost never hit 0% or 100% except in the most extreme cases - very rare events.  


Gold Stocks have been very weak this year, save for the bounce off the May lows. Seasonality wise, precious metals tend to be weak during thee summer months and bottom during late July or Aug.  Gold stocks are also very cheap from a fundametal standpoint and are trading at levels not seen in years.  GDX and some individual gold stocks appear to be lower risk buys.


However if you would rather wait for a 'trigger', one trigger would be the BPGDM closing back over the 8 day moving average as shown in this chart, which is a mechanical system.  For more analysis on precious metals gold, silver and gold stocks, as well as other general market analysis, please sign up for our newletter.  Also we currenly have a 50% sale on our 6 month membership, click here to sign up now

Tuesday, July 24, 2012

AAPL comments

As you know a while back on June 28th, I posted a weekly chart of AAPL, which showed that AAPL was forming a bear flag on its weekly chart.  Here's a link to that post


AAPL post June 28th 


Today as you know, AAPL reported earnings and missed, the stock is down after hrs.  Perhaps this bear flag will end up playing out!  


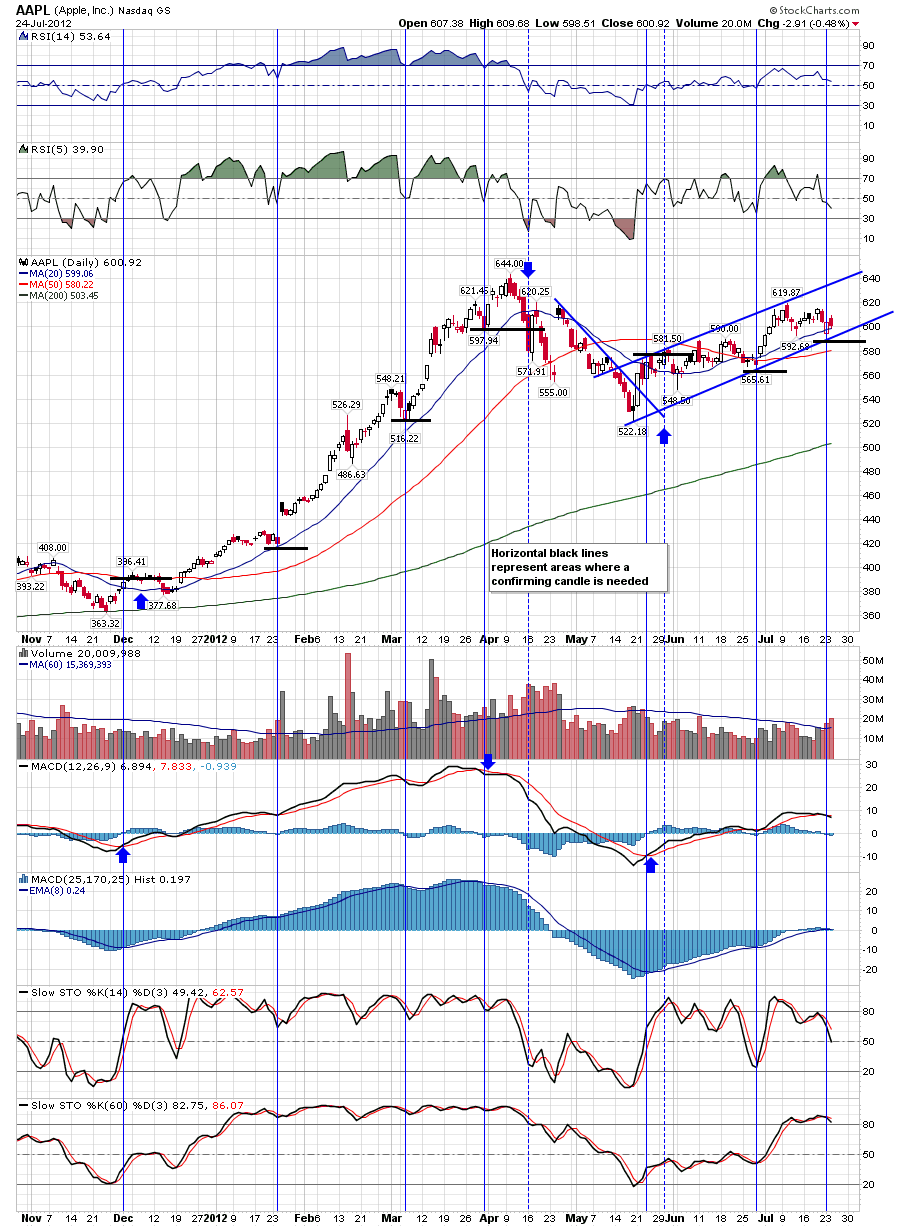
I've attached three charts, the first two charts are weekly charts, the first one shows a bear flag pattern; the declining volume on up move as well as the sluggish response of the MACD indicator is confirmation of this.  The second chart shows another weekly chart and a long term uptrend line from the 2003 lows, that's long term support. The 3rd chart shows a daily chart, watch fro the uptrend line to be broken tomorrow on the gap.

Monday, July 23, 2012

Moon does it again

As you can see, the market once again turned on that moon cycle from last week

Sunday, July 22, 2012

Here\'s our In depth market newsletter


Hello everyone, here's my very comprehensive weekly newsletter, enjoy!


You can view the Newsletter here.


Also if you like our work, please consider signing up to our paid service, right now our 6 month membership is 50% off our regular monthly price and is a great deal! click here to sign up now


Friday, July 20, 2012

VIX 60 min chart

$VIX - Chart Link - 60 min chart of the VIX, which trades inversely to the S&P 500, bull wedge forming

Moon cycle - works again

$SPX - Chart Link - could be working again, providing another inflection point. 


Before you scoff at the Moon cycle, really it's no more leap of faith than traders take accepting Fib numbers and cycles, it's all the same thing really. Otherwise the daily index charts have been wedging higher.

Wednesday, July 18, 2012

Our Comprehensive market newsletter

Here's our recent comprehensive newsletter, it's 40 min long packed with market analysis, but also tons of educational trading examples - in the newsletter Steve takes a lot of extra time discussing our recent trade ideas, with tips and tricks and what to look for with good breakouts and avoiding others. 


Our Comprehensive market newsletter


Also if you like our work, please consider signing up to our paid service, right now our 6 month membership is 50% off our regular monthly price and is a great deal! click here to sign up now


Tuesday, July 17, 2012

GDX Mechanical System comments

This is a chart of the BPGDM, Bullish Percent Gold Miners Index, it has been on a sell signal since June 21st, currently the trade is up 8.3%.  The system will remain on a sell signal until the BPGDM crosses back over the 5 day MA.  Our other mechanical system for GDX based on a Renko chart also remains ona  sell signal.


Gold and gold stocks remain very weak as deflationary forces in Europe and China continue to plage these markets.  Also the lack of a QE 3 from Benanke and the Fed is causing weakness.  Please see my recent newsleters for my in-depth discussion on the gold markets as well as my longer term views.  

Sunday, July 15, 2012

MACD as a trending indicator and other useful trending tools

Here's a series of 3 educational videos that show you how to convert the MACD into a trending type of indicator system using a simply MACD cross but employing our custom whipsaw filter, as well as using various filters like 34 and 60 Stochastics.  Each video is 5 min long.  


-  Video #1


-  Video #2


-  Video #3


Also here's a one min chart of SPY to show you that this method works even down to a one min time frame


- Video #3

RSI 2 systems

most of the RSI 2 revision to the mean systems closed out on Friday.  You can't analyze the market based on those, just pointing out that they closed out on Friday as I had some questions.  


There are a lot of variations to the RSI 2 systems by Larry Conners:  Here's two of them:


The first chart and stats shows SPY, Longs: when RSI 2 falls below 10%, exit on a close above the 9 SMA (price must be above the 200 day MA).  Shorts: Price must be below the 200 day MA, short when RSI closes above 90%, exit price closes back above the 8 day SMA.


The 3rd chart and 4th stat shows a scale in version, however prices are exited when RSI closes back above 80% for longs, and back below 40%

Wednesday, July 11, 2012

Initial Jobless Clams vs S&P 500 - interesting chart

Tomorrow 1 hr before the market opens the Initial Jobless claims will be released, obviously they will be heavily looked out.


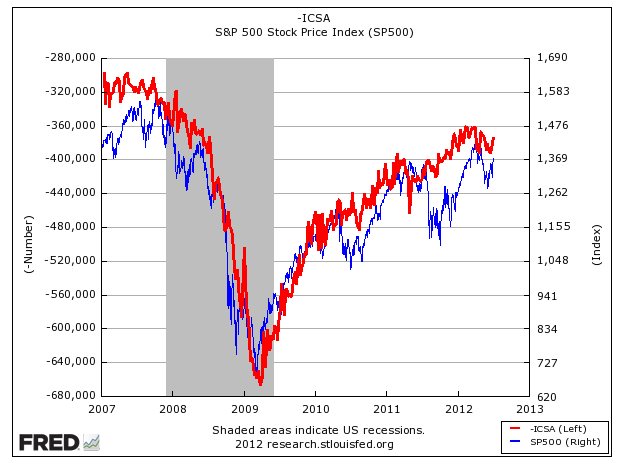
Here's an interesting chart of the Initial Jobless Claims (in red) plotted with the S&P 500 (in blue); while the correlation isn't perfect, it's pretty good and enough to get your attention.  If the weekly jobless claims started to increase (move down - note the left side scale), the market will follow.  Anyway longer term chart, but something to pay attention to over time. 


http://research.stlouisfed.org/

Monday, July 9, 2012

Our Comprehensive market newsletter


Here's our most recent newsletter covering a broad spectrum of the market and commodities, systems, trade ideas etc


You can view the newsletter here.


NYMO McClellan Oscillator Warning Follow Up


On July 3rd last week, I posted the NYMO McClellan Oscillator which was pointing to a pullback coming for the market, here's the update to the chart, clearly the chart has played out as the SPX has pulled back 30 points from last weeks high on July 3rd.


Keep this chart as a useful trading tool going forward, as you can see it is useful for marking tops and bottoms


Post from July 3rd


Moon cycle follow up

$SPX - Chart Link - Full Moon last week on Tuesday market at least a short term top and pullback, lately the moon cycles have been marking inflection points as you can see.  The next moon cycle is on July 19th.


Here's my post from June 25th two weeks ago on the moon cycle


Original Moon Cycle post

Tuesday, July 3, 2012

NYMO McClellan Oscillator Warning

Here's a chart of the NYMO McClellan Oscillator - note that it closed in an extremely overbought condition.  Now study the chart for a moment and note how well this indicator has been at marking at least short term tops and bottoms, the S&P 500 is plotted at the bottom.  Therefore with the NYMO in such an overbought condition, it would not surprise me to see the market soon have some kind of pullback.


Otherwise please enjoy your 4th of July and also if you like our work, please consider signing up to our paid service, right now our 6 month membership is 50% off our regular monthly price and is a great deal! click here to sign up now

Sunday, July 1, 2012

our Mega Weekend Commodity Newsletter


Hello everyone, here's my very comprehensive weekly commodity newsletter, enjoy!


You can view the Newsletter here.


Also if you like our work, please consider signing up to our paid service, right now our 6 month membership is 50% off our regular monthly price and is a great deal! click here to sign up now