Thursday, August 29, 2013

SPY Pro System achieved its first scale out

As I stated previously, the SPY Pro Scaleout version would scale out of 20% of its shares at a 1% gain at a price of SPY $164.96, that just occurred as you can see from the chart.  Again if you are following the scale out version  please don't wait for me to post the confirmations, as I stated, the best thing to do is to simply place a GTC sell limit order in at your broker when you first enter the trade, that way it will just execute automatically for you.


I'm also including the stats: 96.05% winning trades, 684 total trades, 93 consecutive winning trades, 2 consecutive losing trades and a beautiful profit curve.


In regards to the rest of the system trade, if SPY closes over the 8 day moving average, the system will exit it's total position and go to cash, that's actually not to far away and something you can monitor on your own, just add an 8 day MA to a daily chart of SPY.

Tuesday, August 27, 2013

SPY pro system response to a question

I had a question regarding the SPY Pro yearly gains - here's a few snapshots of reports.  The SPY pro as a single entry and exit gained an average yearly gain of 32% over 19 years, This year is still open and 2011 was the worst year of course (in fact all reversion to mean systems suffered that year).  The SPY Pro scaleout version has a much higher winning % of 96% vs 90% for the single entry/exit version but a lower total gain, which makes sense because it doesn't always have a full position as it scales out too early sometimes - made an average of 22% per year.  This is all non compounded, which means that the same $dollar amount was invested in 1995 as was recently, i.e. $100K for each trade.  


If you throw compounding into the mix, the returns of course do what you would expect with the power of compounding.  The second chart shows 100% compounding and 50% compounding, which means that 100% of the profits were re-invested in one version and 50% in another - to me the 50% version makes more sense.  


again it's up to you to do what you want, I'm just posting this because a member asked me some questions about yearly gains and single entry vs multi entry etc.


Also from a time standpoint, the SPY pro system is only in the market 46% of the time, which means it is in cash more than 50% of the time.


The other systems are in the market less, for example the SPY RSI 2 system is only in the market about 23% of the time, which means it is in cash 77% of the time however even being in cash this much it is still able to generate 13% average gains per year non compounded, not bad.

Just go back a few in ago - update on SPY Pro system, etc

I have updated the SPT Pro trades on the website to reflect the statistics and the trades, as you are well aware of, the SPY pro and SPY Ver 2 systems closed out their long trade this morning on the open - this was covered on Friday via an email and blog sticky post.


Anyway another good trade for the SPY systems, the DVY RSI 2 system is still in a trade of course, it needs a close back above the 9 day SMA to get an exit signal, which it missed by only 3 cents on Friday LOL.


The SPY Pro now has 96.05% winning trades, SPY Ver 2 now has 86.21!, the SPY RSI 2 system has 86.11% winning trades.  The DVY RSI 2 system has 90% winning trades but we'll have to see how this trade closes out.


Here's a few snapshots of stats and performance curves and yearly gains.  I will discuss these in tonight's newsletter of course.

Sunday, August 25, 2013

Here\'s our awesome free weekend newsletters!

Hello everyone, first off I hope all of you enjoyed your weekend!  Once again here's our very comprehensive weekend newsletters; normally I don't post both of these for free each weekend, however I wanted to do a follow up on our newsletters from two weeks ago and plus our analysis has been pretty awesome as of late. 


- CLICK HERE to view the general market newsletter


- CLICK HERE to view the commodity and precious metals report


Enjoy your week and please consider joining our paid service, here's a URL to our sign up page.


Matthew Frailey


Monday, August 19, 2013

Commodity Newsletter and General Market Newsletter from BPT

Hello everyone, first off I hope you had a nice weekend! As you know last weekend I sent you two of our newsletters, one for the general market and one for precious metals commodities:  


These newsletters were spot on because in our General Market Newsletter we warned about a top in the market and then last week the market subsequently had a strong correction.  Also in our commodity precious metals newsletter I stated how gold stocks looked the best they have in many months and looked like great swing trade candidates, well last week gold stocks on average rallied 12.5%!   I hope you guys paid heed to these newsletters and made some profits!


Anyway here's our followup weekend newsletters:


1. Commodity Precious Metals Weekend report


2. Weekend General Market Newsletter


Please take the time to review and I hope that you consider becoming a paying member of Breakpoint Trades.


best regards,


Matthew Frailey

Thursday, August 15, 2013

Man some of these moves awesome!

Some awesome moves lately!  swing trade examples, and many of these techniques discussed in Steve's tutorials as well - congrats to those of you who caught some of these for swings


CDE - Chart Link,  EXK - Chart LinkEGO - Chart LinkABX - Chart Link


AG - Chart LinkAU - Chart LinkAUY - Chart LinkNEM - Chart Link


NEM - Chart Link 

Head & Shoulder pattern playing out beautifully

$SPX - Chart Link - If you've been following our newsletters we became very cautious last week and especially over the weekend and this week as we spotted these Head & Shoulder patterns, thus you should not be surprised at this market sell off as these patterns are clearly playing out now

SPX 60 and 30 min comments

$SPX - Chart Link - well gap and go - as you see the SPX gapped below the confluence of trendline supports; the market has a tendency to just gap over an inflection point.  Clearly no one here should be too surprised as Steve and I have been advising caution for the market since last week and especially this week


$SPX - Chart Link - 60 min view with Fibs


$SPX - Chart Link - 30 min view

Wednesday, August 14, 2013

SPX Daily

$SPX - Chart Link


$SPX - Chart Link


As I discussed last night,  the SPX is nearing a SHORT TERM inflection point.  Of late we have seen lethargic action leading to a choppy decline which has allowed the oscillators to unwind some of their overbought readings. The SPX is still finding support from its 20 EMA (important to hold). So the question here is if the SPX can may another attempt at new highs (the QQQ's did) or if it fails and forms a lower high (RS) and turns down.  Thus, it's been mainly a trader's market of late with many trading around earnings.  Simply put, the 20 EMA is the key support with resistance at 1700 and 1710. Continue to trail stops upward on longs and if playing shorts also adhere to proper stops. 

Sunday, August 11, 2013

General Market Newsletter for Sunday August 11th 2013

Hello Everyone, here's our General Market newsletter for the weekend, the
market is at a major infection point here, so be on your toes!  Also our
25% coupon expires in 2 days, so take advantage of that! 

You can view the newsletter here.


Thursday, August 8, 2013

GDX chart

GDX - Chart Link Steve's daily that he made early last week for a tutorial, price tagged that trendline target and reversed


GDX - Chart Link - another daily


GDX - Chart Link - 15 min view, you had time to jump on it this morning


GDX - Chart Link - 60 min chart with Fibs, bounce tested the 130 MA, which is the same as the 20 day MA, and 50% Fib.  Steve added a potential wave count either ABC or a more bullish 5 wave, even under the ABC would make another high.


For those of you who want to hold - GDX has no business retracing all of today's gains, so you could use that as a stop, you dont' even want to see it retrace more than say 60% of today's candle - so these are some guidelines should you wish to give it some room vs just day trading

Saturday, August 3, 2013

Nice chart showing long term fib cycles

Nice chart showing long term fib cycles

Friday, August 2, 2013

The market has made the majority of its gains overnight on gaps - powerful statistics

The market gaps a lot and had little movement intra day - in fact the market has made the majority of its gains overnight on gaps.  I've shown these statistics a few years ago, however I thought it was time to post them again because they really illustrate this point well.


I wrote two very basically strategies in Tradestation to graphically illustrate this point:


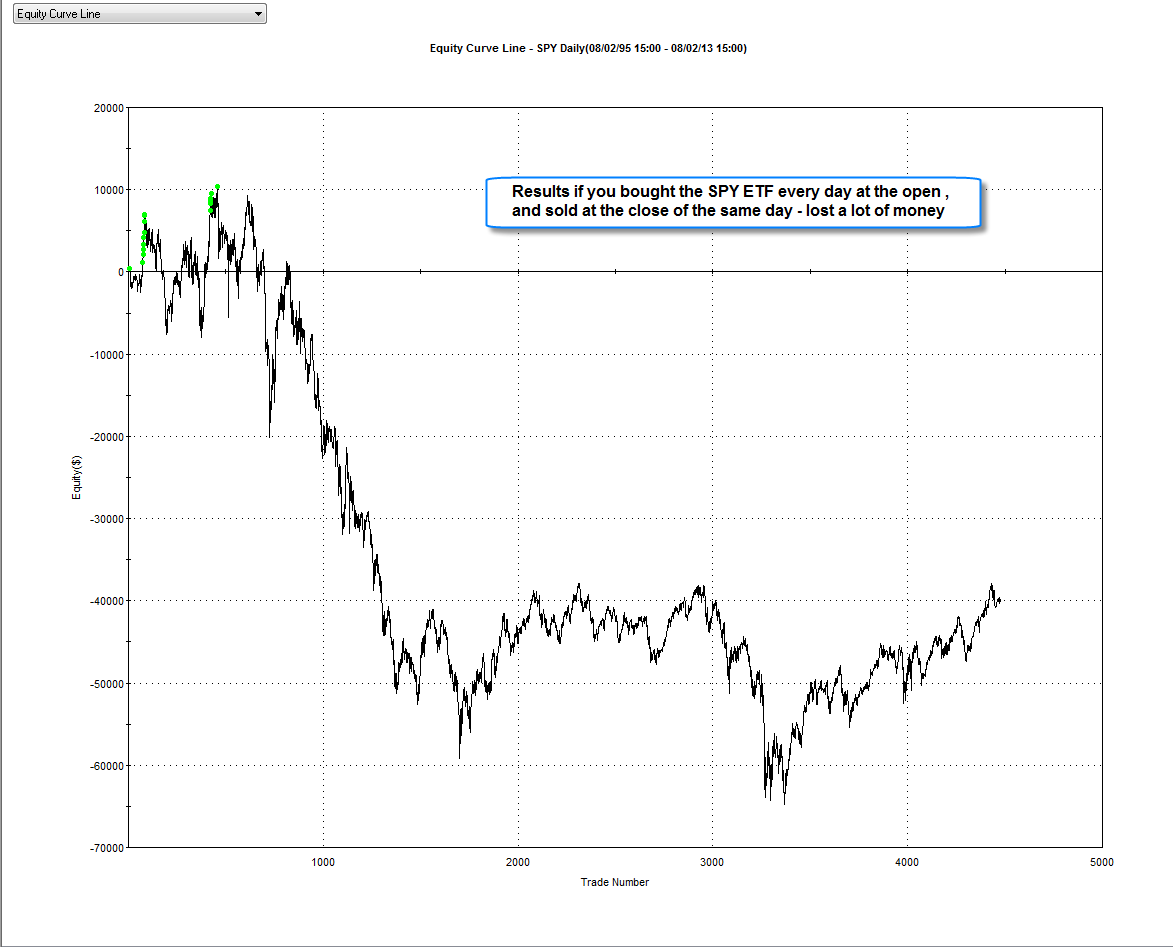
One strategy simply buys the ETF SPY at the open and sells it on the close of the same day.


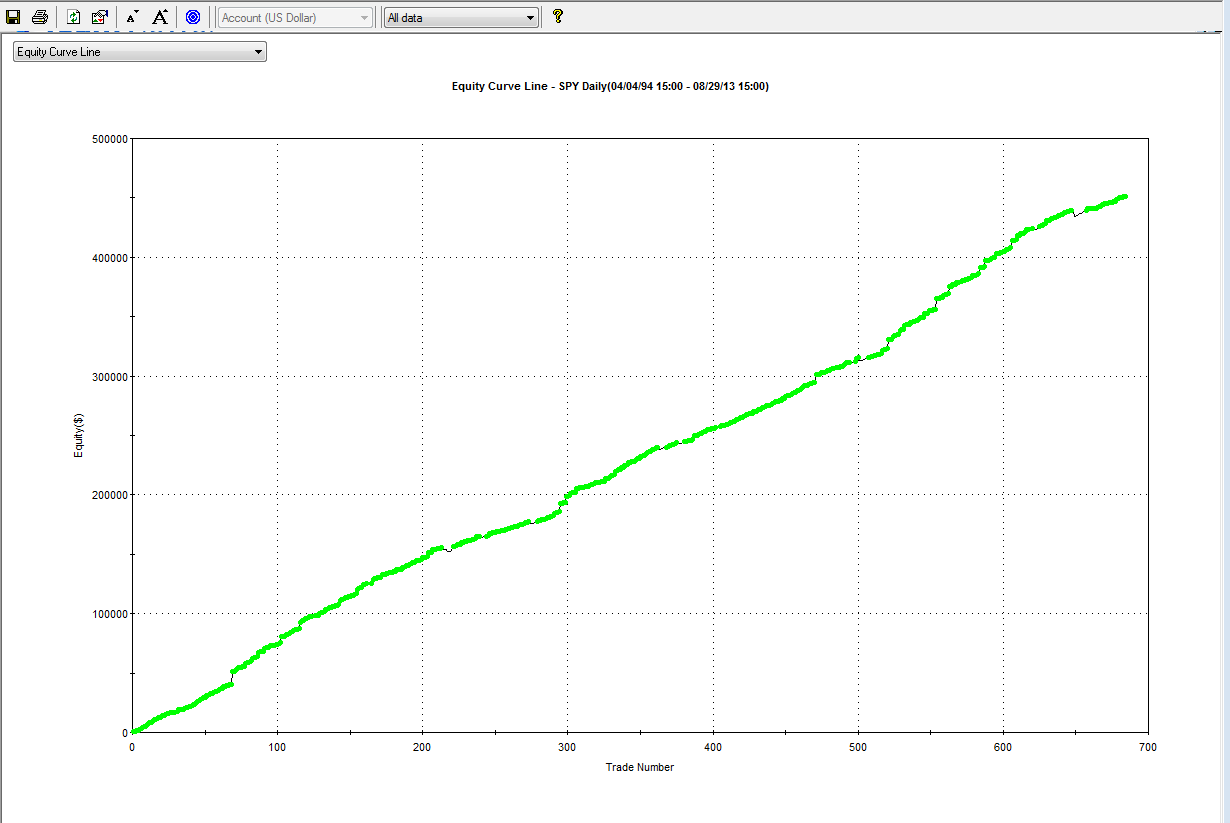
The other strategy simply buys the ETF SPY at the close and sells it on the open of the next day.


For the strategies I'm using $100K for each buy and I'm not counting commissions because these are not meant to be strategies that you actually trade - I'm simply showing the effect that gaps have had on the market over the last 18 years.


As you can see from the two profit curve charts below, the results are quite astounding, if you bought the SPY ETF every day on the open and sold it at the close of the same day, you lost money consistently every year!   Your $100K turned into about 60K losing about $40!.  Amazing that you actually lost money simply buying the open and selling the close.


The second chart shows what happens if you simply buy the SPY at the close and sell on the open of the next day - as you can see, your $100K turned into over $400K!!  Quite a difference!


So as you can see - if you recently thought to yourself, "man the market gaps all the time and seems to make most of its moves overnight" you are right - in fact the results are probably more shocking than you realize.  The public masses think that the market makes its gains during the day, but this is not the case.


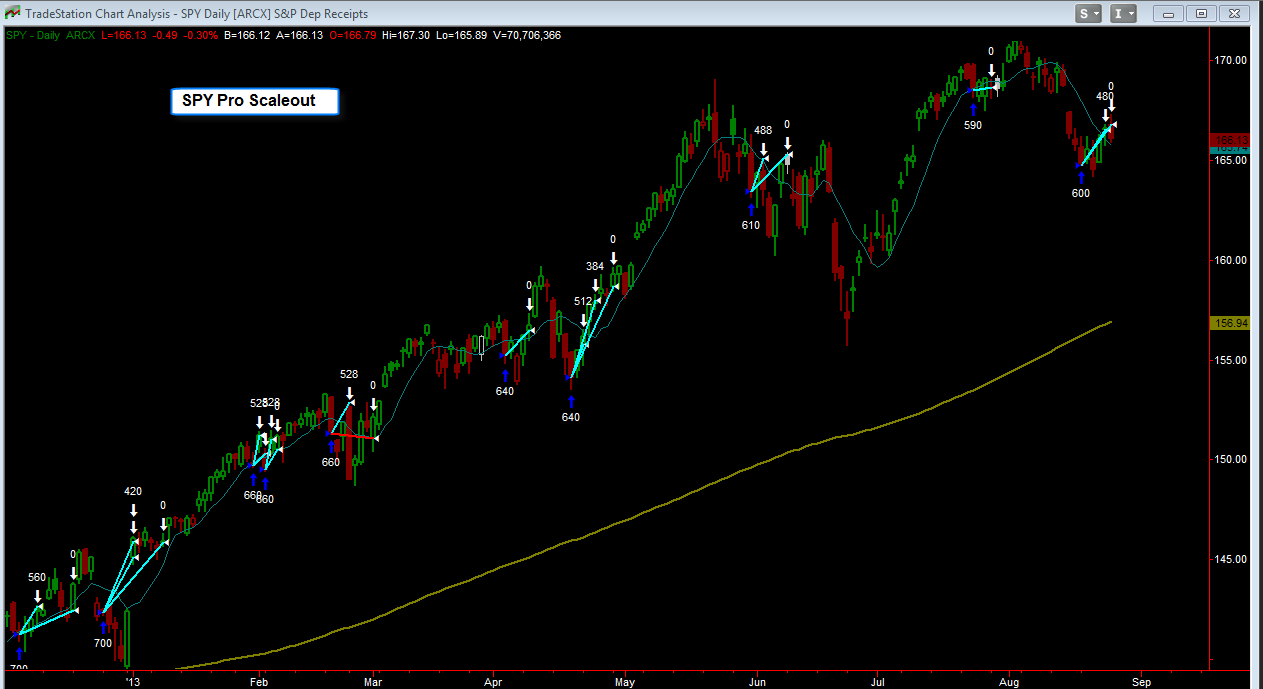
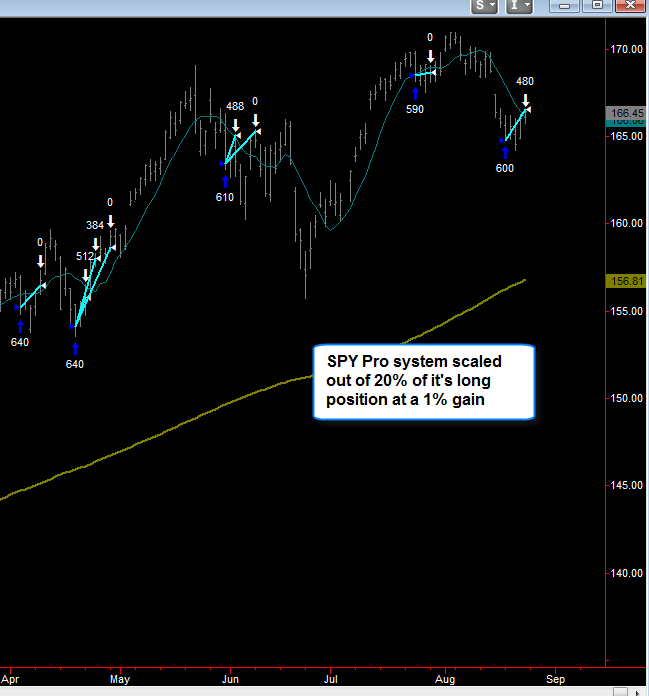
Also guys - regarding the SPY Ver 2 and Pro systems - this is why those systems exit their long positions on the next day open vs that same day

Thursday, August 1, 2013

Updated Market Stats

Earlier this year in January I posted these market stats - one shows the effect of a strong January, this year the market closed up 5% for Jan, which boded well for the year with every year except for 1987 gained 20% or more after gaining 5% or more in January.  Then we had a very strong 1st quarter this year, which also boded well for the year as a whole (95% chance via the stats), by the way the market had a strong 1st quarter last year as well.  Currently the Dow is up 16% this year (SPX is up 19%).  Obviously the 3rd quarter isn't closed yet and we'll probably have some kind of pullback during the 3rd quarter - however historical stats still suggest the market will close the year up 10% more more, the one exception was 1987 where the market had a 23% correction in the 4th quarter, however ironically it still ended up 2% of the year because the first quarters were so strong