Tuesday, March 31, 2015
Monday, March 30, 2015
SPY Pro system 1st scaleout achieved
Hello everyone, the SPY Pro system achieved it's first scaleout! Remember this system scales out of 20% of it's position after a 1.25% gain in profit. This leaves 80% of the shares still in a long trade. So far nice trade from the lows of last week! Had someone simply bought 100 shares of SPY, one would nearly have paid for a 6 month membership.
For the SPY Pro combined system - since this system combines all three SPY systems (SPY Pro, Ver 2, and RSI 2), you would sell only 8% of your shares and still have 92% of the position.
By the way, the next scaleout comes in at a 2.5% gain for the SPY pro where it will sell another 20%, and of course another 8% for the SPY Pro combined system

Sunday, March 29, 2015
Friday, March 27, 2015
Thursday, March 26, 2015
Wednesday, March 25, 2015


Tuesday, March 24, 2015
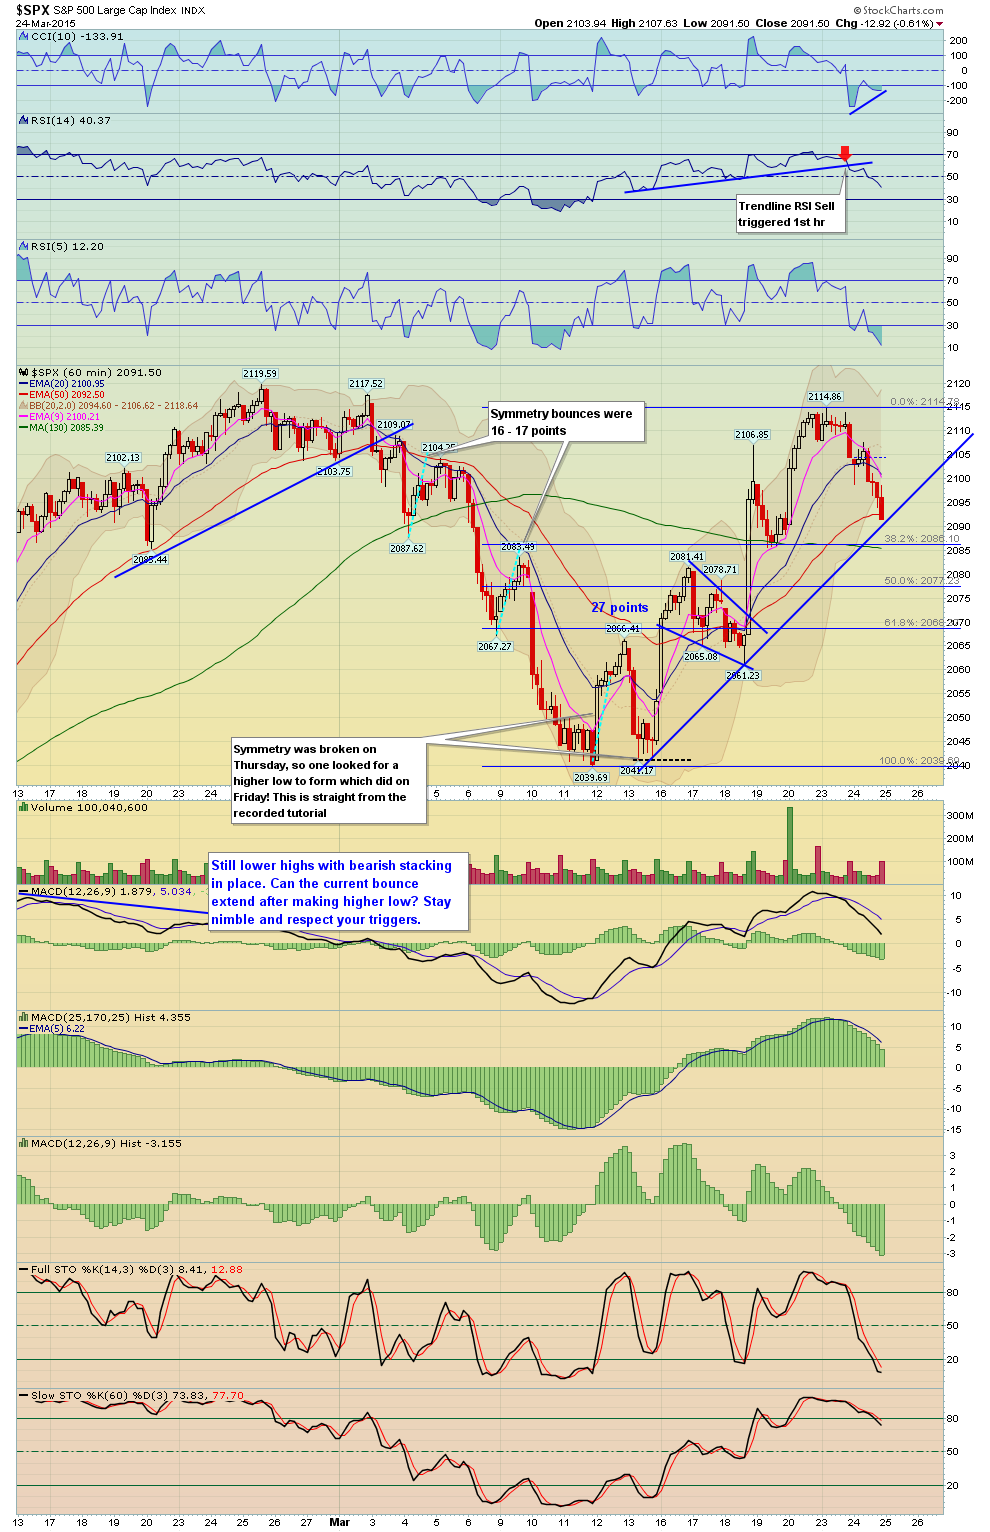
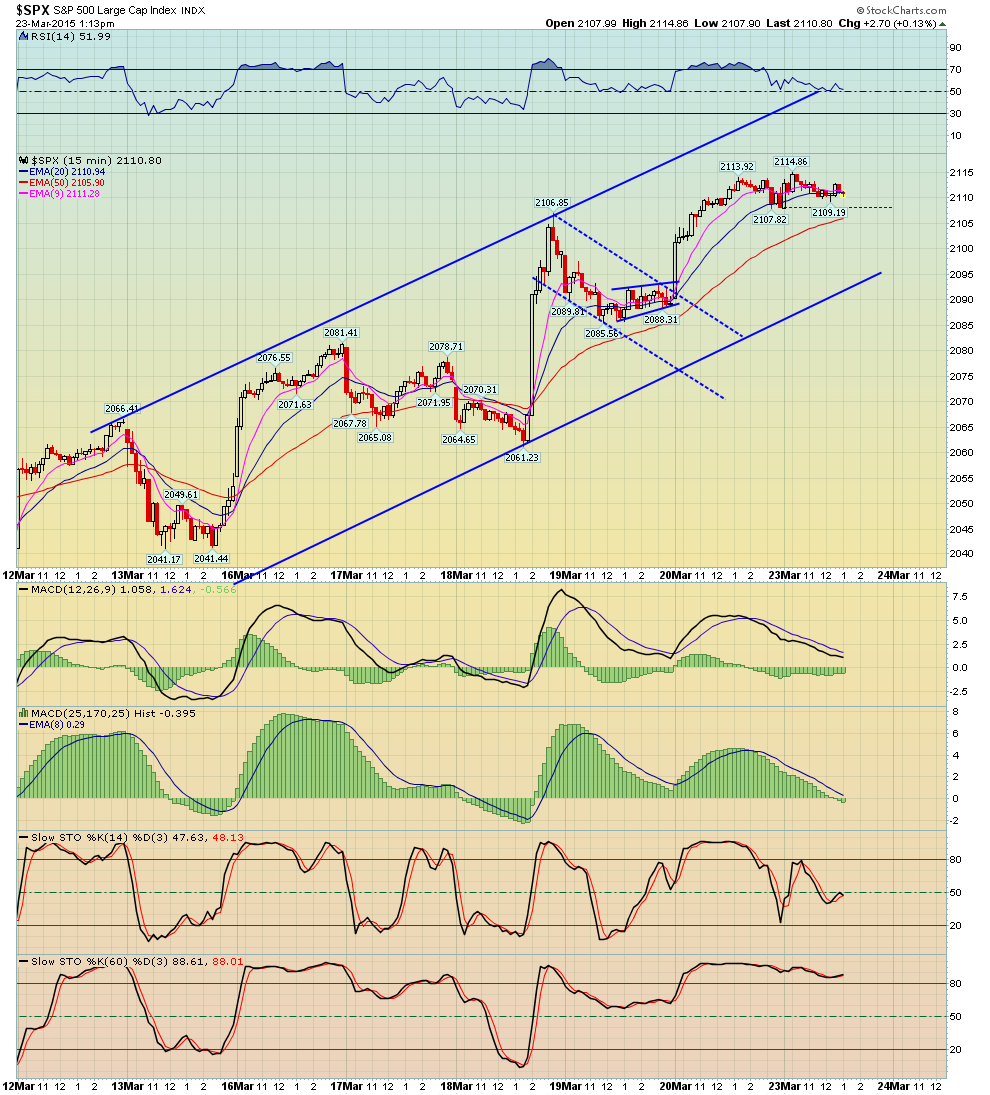
SPX 60 min views
$SPX - Chart Link - with Fibs, first off that RSI trendline break occurred the first hr. Anyway an uptrend line from the lows here to monitor, some div on the CCI
$SPX - Chart Link - another view shows how a RS could form of a H&S pattern, notice we closed right on that uptrend line. However under this scenario notice the neckline would be slanted up, so another thing that could occur if there as some morning weakness (but not too much) that would allow the neckline to be flat vs slopped up, then bounce to for a RS.
again too much sell off would negate it and I'm simply throwing out things to monitor

Monday, March 23, 2015
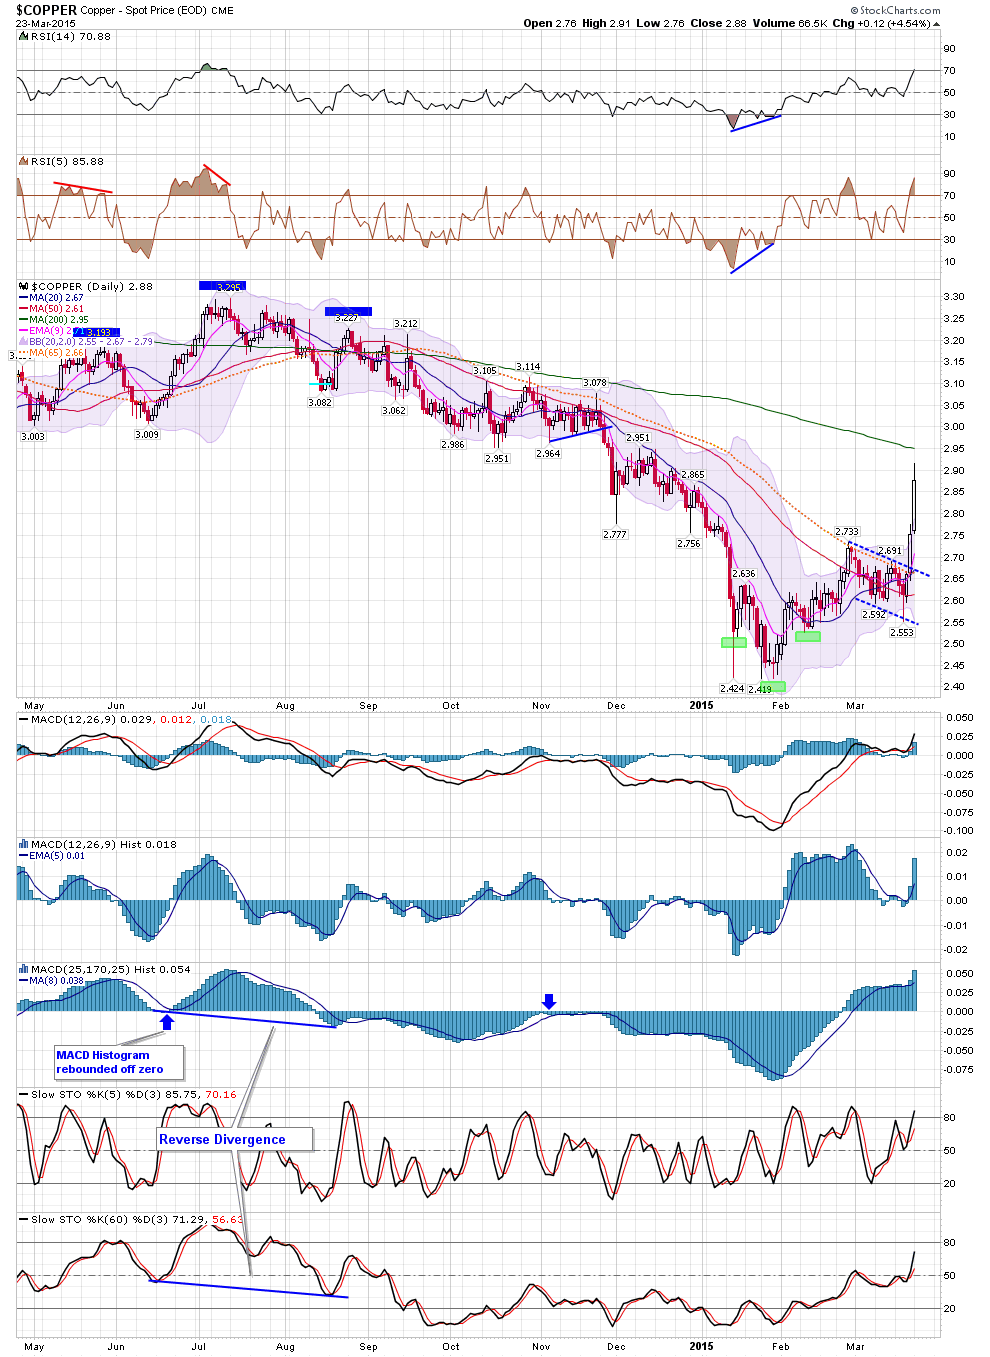
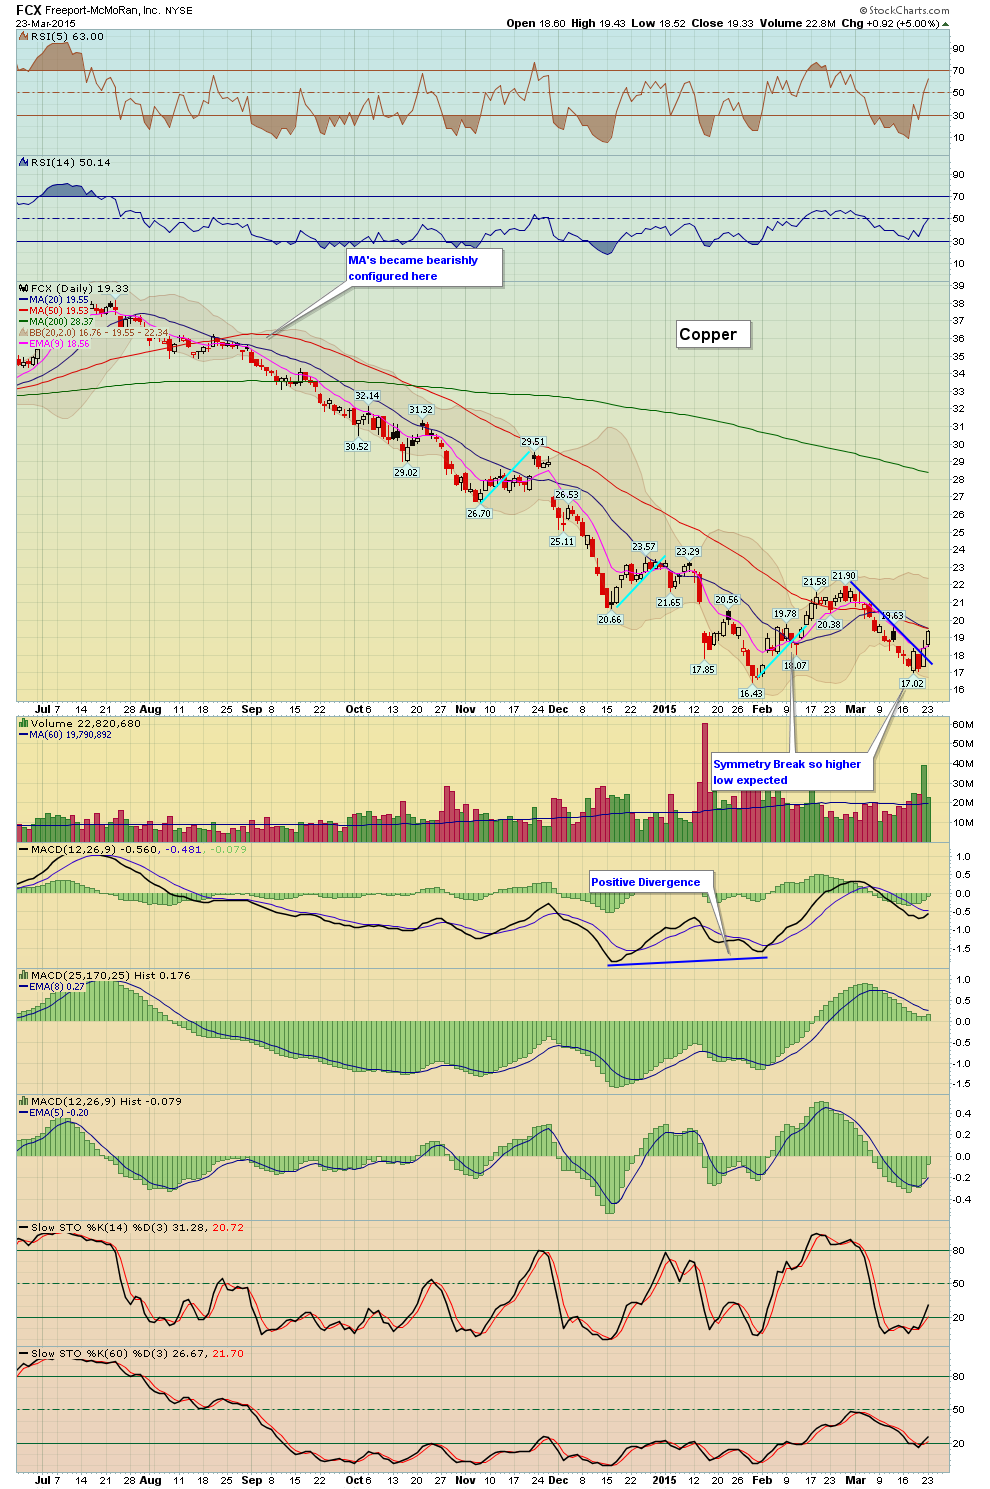
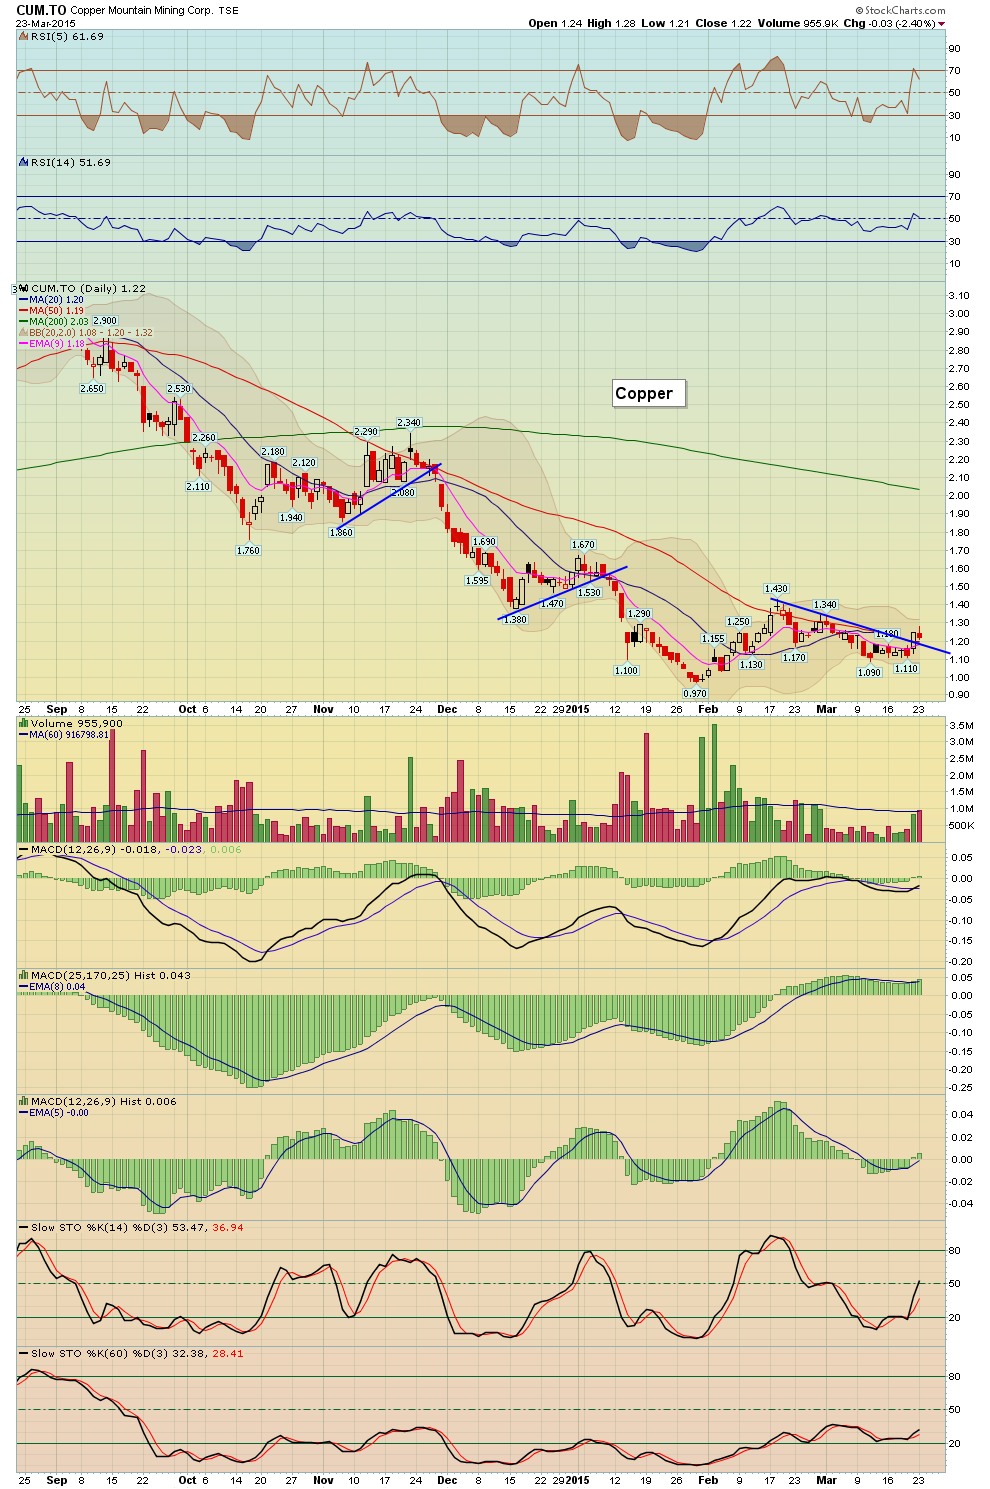
Copper had a big day and follow through from Friday
$COPPER - Chart Link - big follow through from Friday's gain
JJC - Chart Link - ETF
FCX - Chart Link - long idea we've had on the list - as expected with the symmetry break it made a higher low, continue to monitor this one going forward
SCCO - Chart Link - there's not a lot of copper stocks, most are in Canada, here's a couple to monitor should they follow suit


Friday, March 20, 2015
Thursday, March 19, 2015

Wednesday, March 18, 2015
Here's our Market Newsletter
CLICK HERE to view the Newsletter
Matthew Frailey
Tuesday, March 17, 2015
As a visual confirmation, the SPY Pro and Ver 2 ...
As a visual confirmation, the SPY Pro and Ver 2 systems closed out their trades on the market open and went to cash. All three systems closed out profitable trades albeit the profit was tiny for the SPY Pro, however the other two with their second entries made nice profits.
Also just to be clear for those of you who might be new or new to the systems - The action of the SPY systems exiting their long positions and going to cash should NOT be construed as a sell or short signal for the market! Do not short the market based on the SPY systems going to cash. Remember the goal of the SPY systems is to simply identify a trade situation, get in and get out, that's it. These are not trend following systems, they are reversion to mean systems that attempt to buy pullbacks in uptrends or short rallies in downtrends - get in and get out.
The system has very specific short signals, which are not in effect at this time.


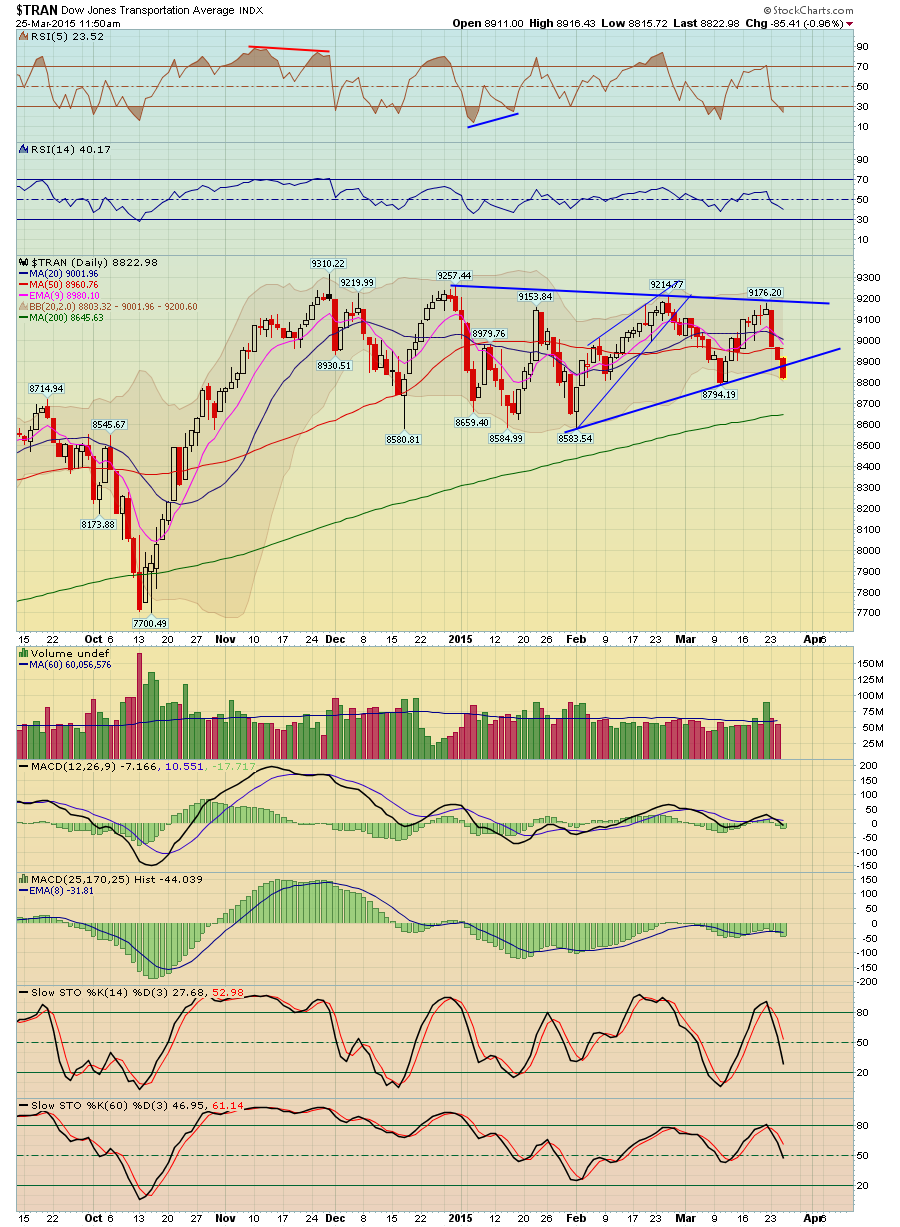
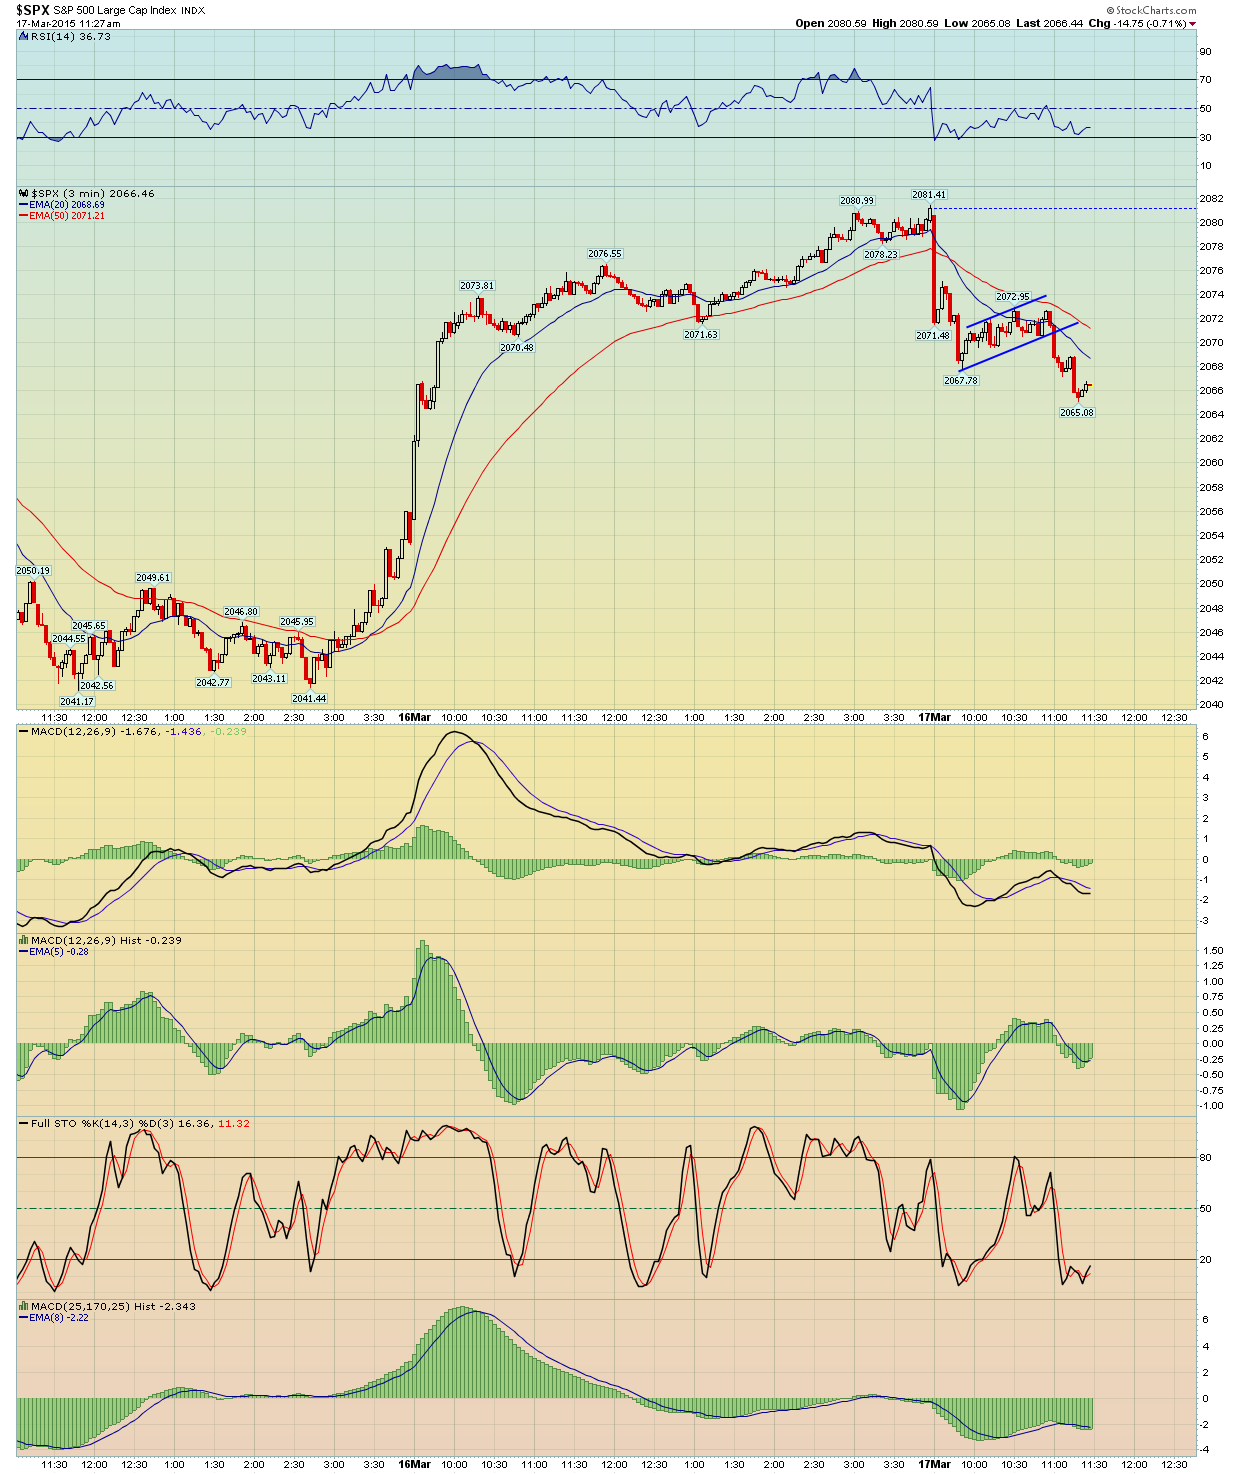
SPX 120 Minute
Possible backtest of trendline? Keep an open mind and respect your triggers. Internal readings (breadth) are solidly in bears camp now...continue to monitor.

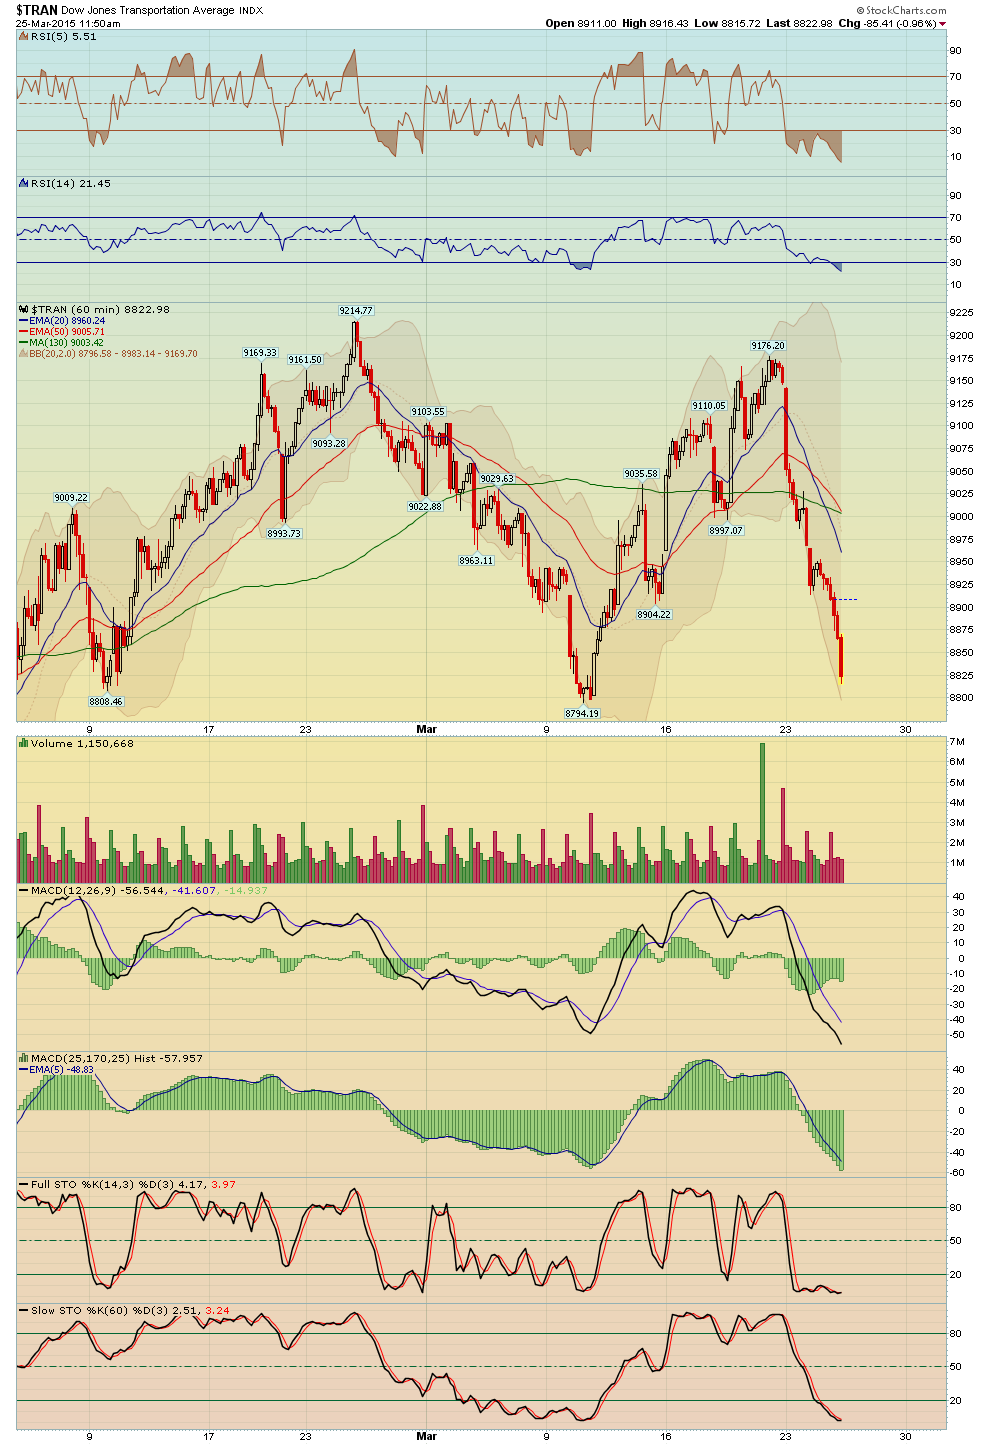
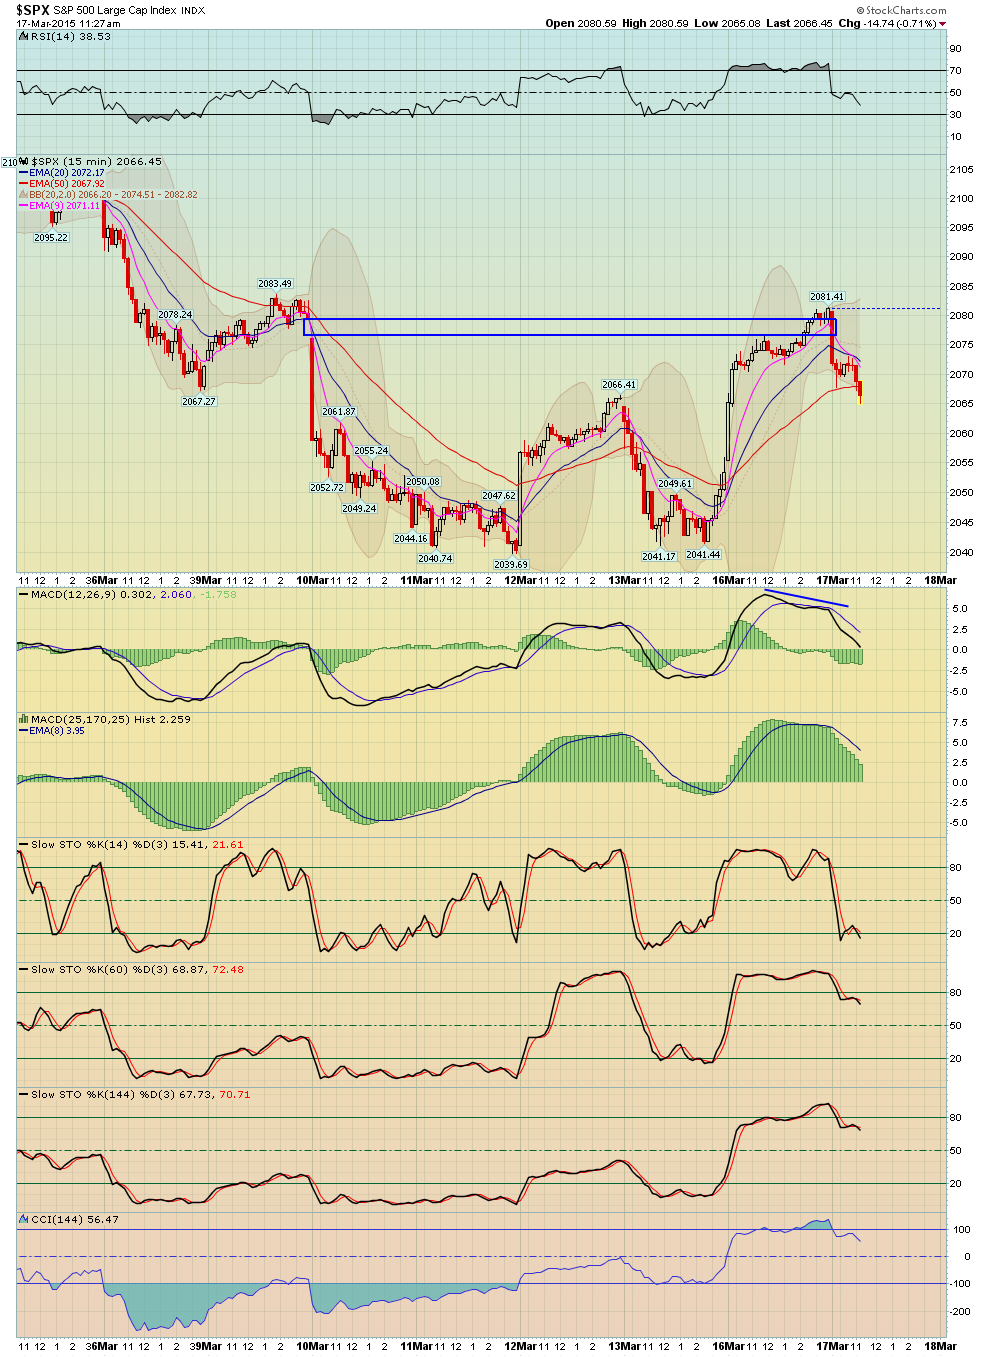
SPX Intraday Views
Filled open gap yesterday which had the index quite overbought and today pulling back (Matt pointed out bear flag below)

Monday, March 16, 2015
Sunday, March 15, 2015


Friday, March 13, 2015

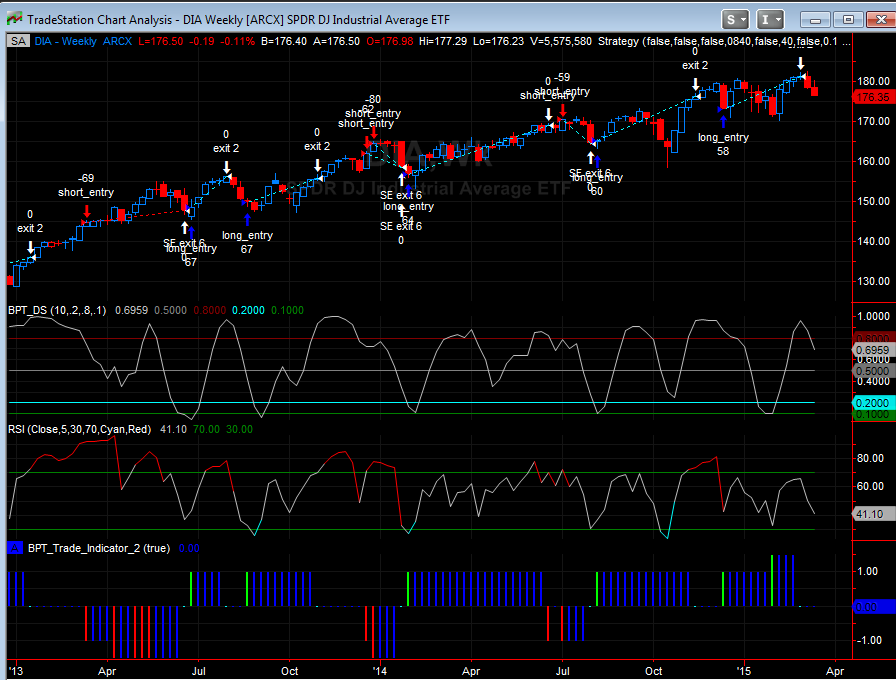
Weekly ETF systems - example
So here's an interesting example to point out: As I sad I have a basket of these weekly ETF systems, I run two different systems on them, one reversion to mean and one trend following or breakoutt - so each ETF has two systems running on it on two different charts, so if there are 10 ETF's, there would be 20 charts, with 10 of them running the RVM system and 10 of them running the trend following system. At times you will get both systems long or short, or you can get cases when one is short and one is long.
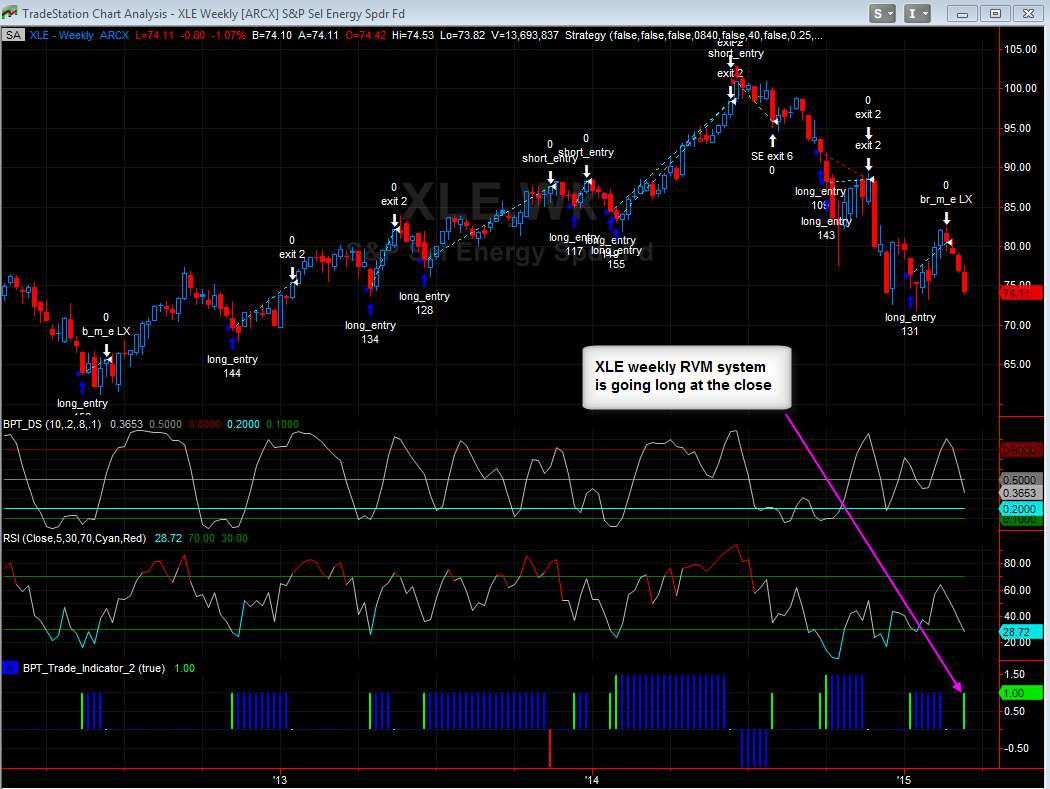
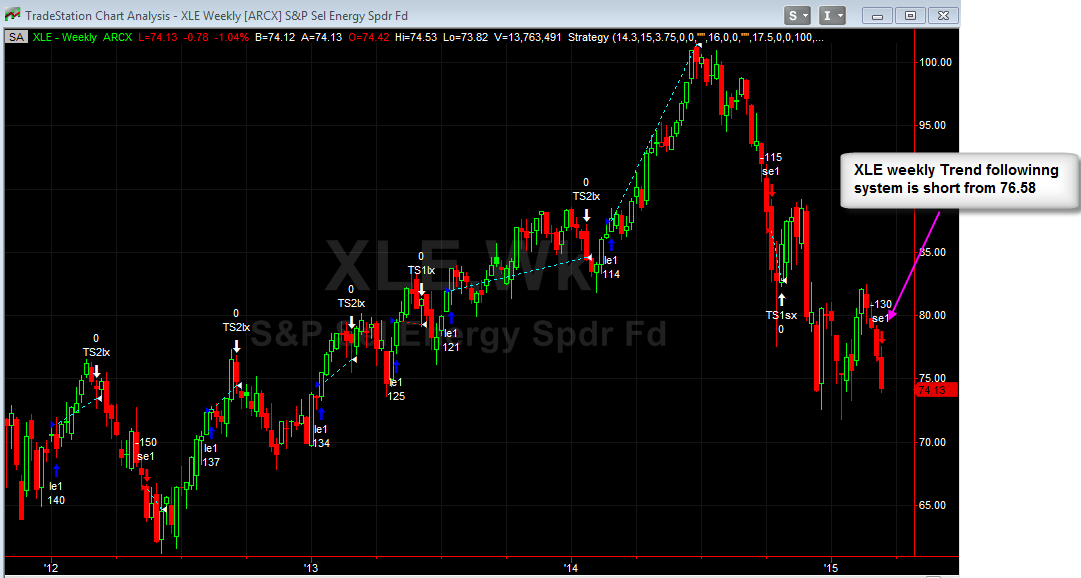
Here's an example on XLE, the energy ETF:
The first chart shows XLE running the RVM system, notice that it closed out a profitable long trade just over 3 weeks ago, however now it's going to go back long today at the close, see the green indicator bar at the bottom of the chart.
The second chart shows XLE running the trend following system, notice that it's already short, it went short at 76.58 on Monday, so it's up nicely.
Anyway what's going to happen when the RVM system goes long today at the close is that the short profit will have been locked in and you will have a 'Net Zero' position since they both cancel each other out. Should the market continue selling off and XLE goes to new lows, it cancels the early RVL long trade, or vice versa should XLE rally next week.
anyway just showing an example of what will happen at times once I release these systems, you will have trades that are both long and short at the same time
always keep an eye on those pivots on ES, the ...
always keep an eye on those pivots on ES, the ES trades around them

SPX 1 and 5 min
$SPX - Chart Link - unable to break symmetry thus far on any bounce
$SPX - Chart Link - 5 min still quite ugly, some RSI div but not really on MACD


Thursday, March 12, 2015
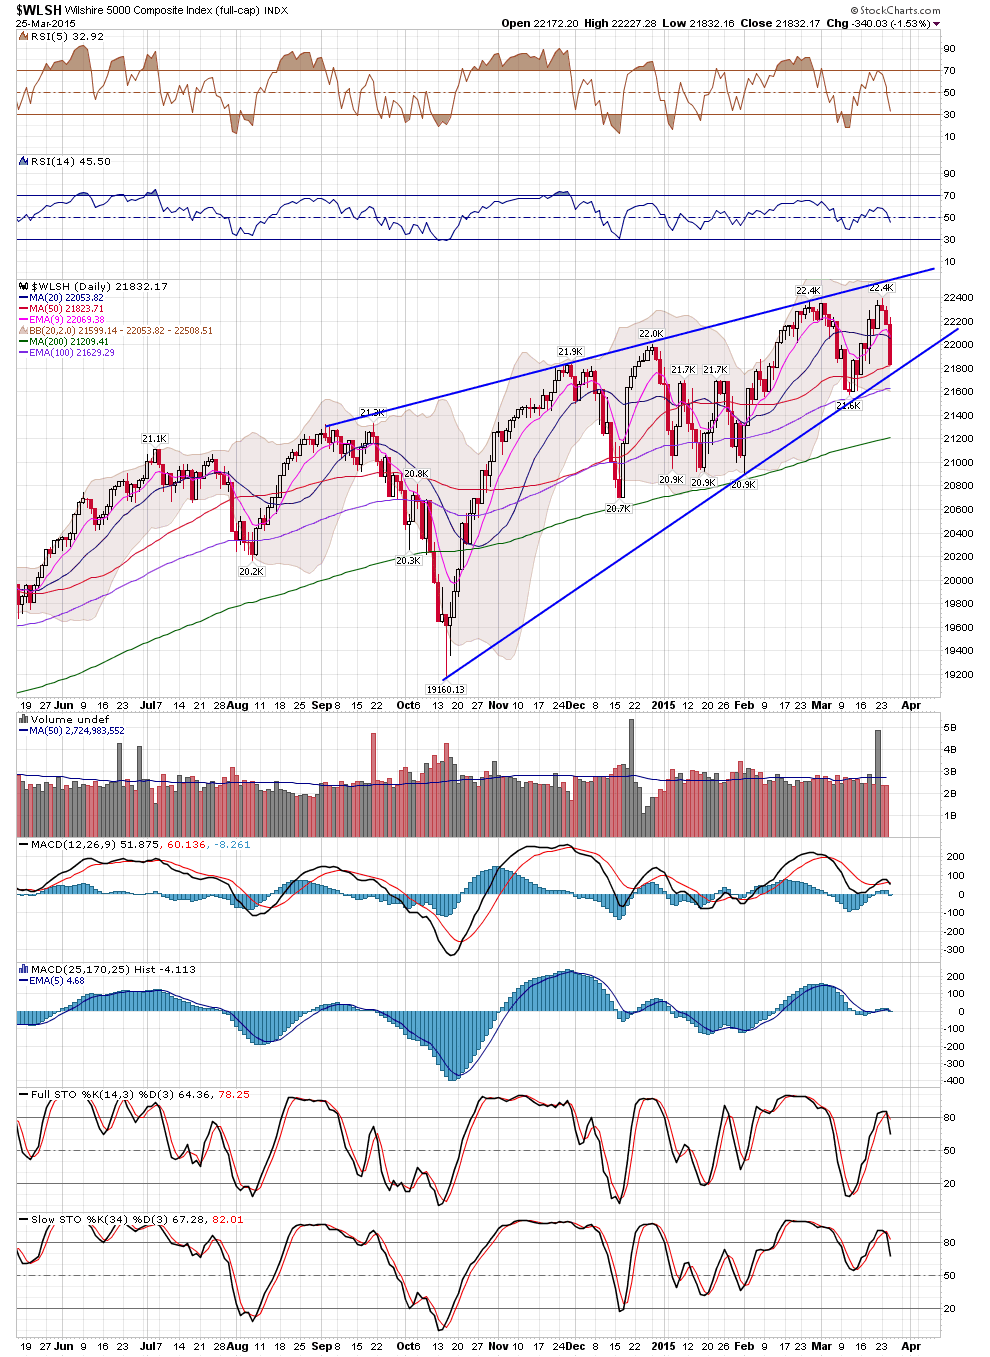
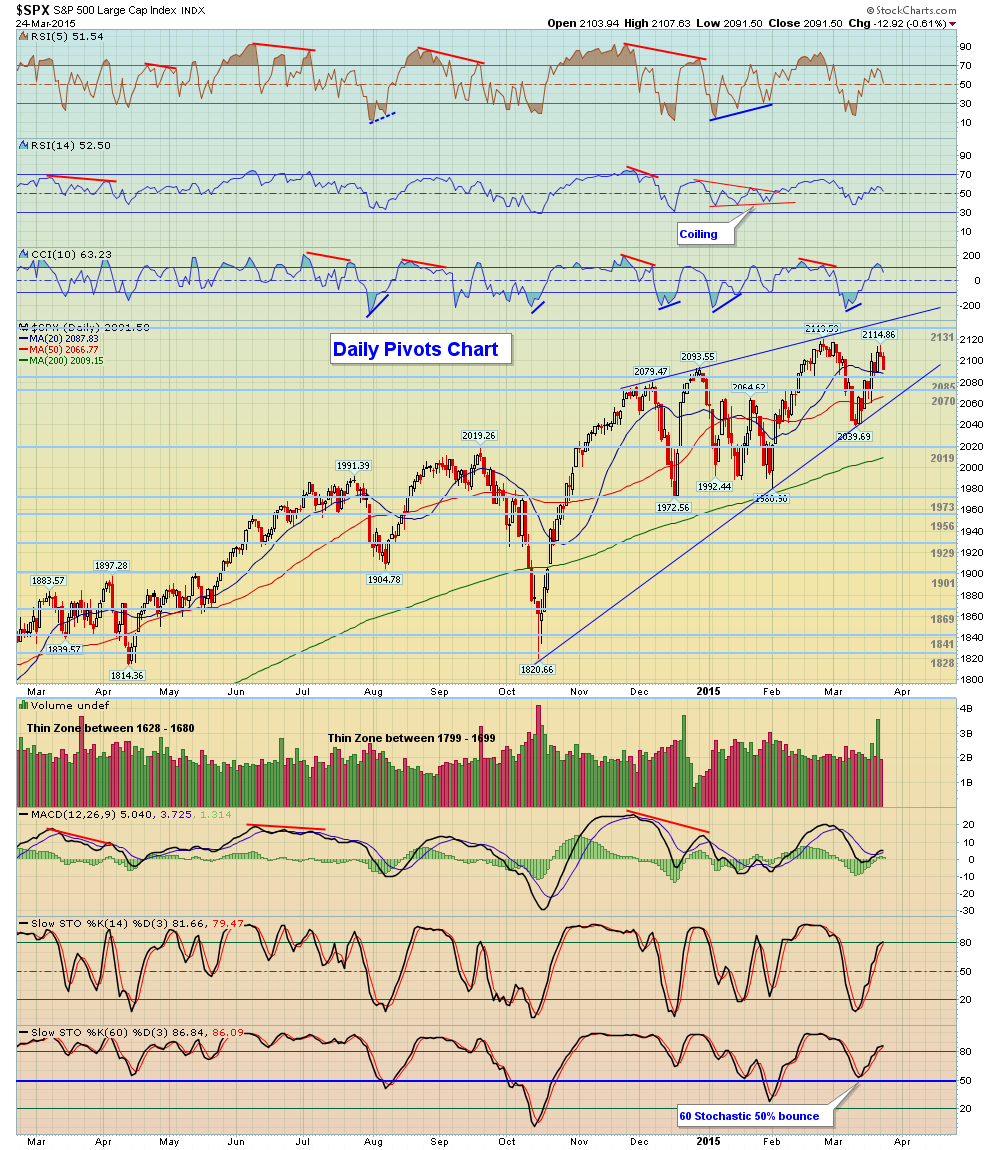
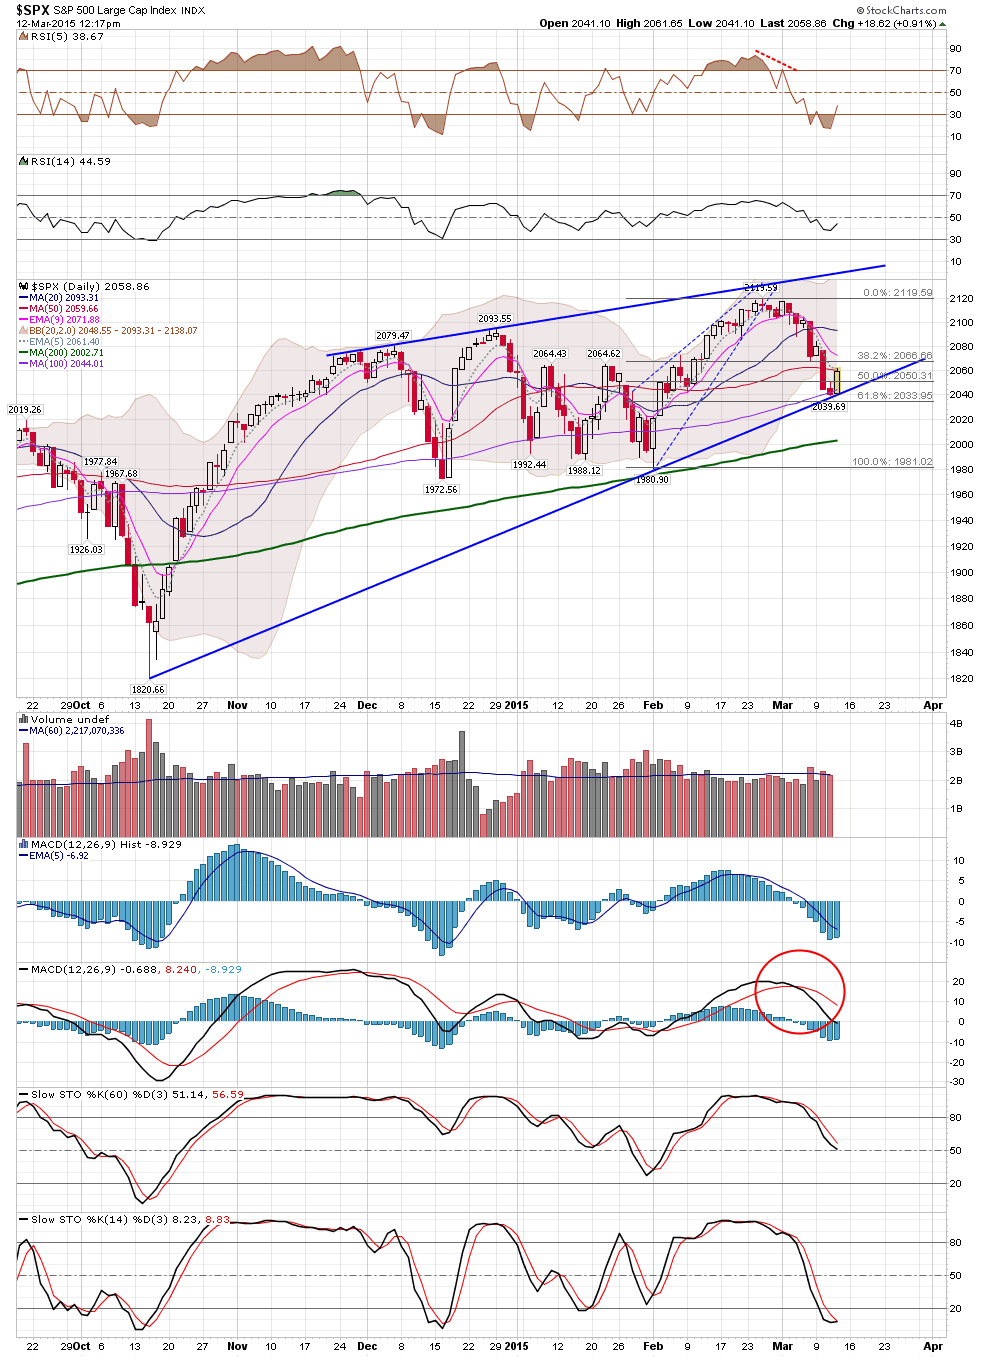
SPX Daily View
Bounced off trendline and moved up to 50 day MA...on pullbacks would prefer to see it hold 50% of today's range to suggest continued upside momentum.
Wednesday, March 11, 2015
Our Most recent newsletter
Hello everyone, here's our latest newsletter, this one is longer than normal because along with my general market analysis, I also discuss some new mechanical systems, educational examples, as well as trade ideas.
CLICK HERE to view the Newsletter.
Also please consider taking advantage of the 20% Sale we have going on right now.
Matthew Frailey
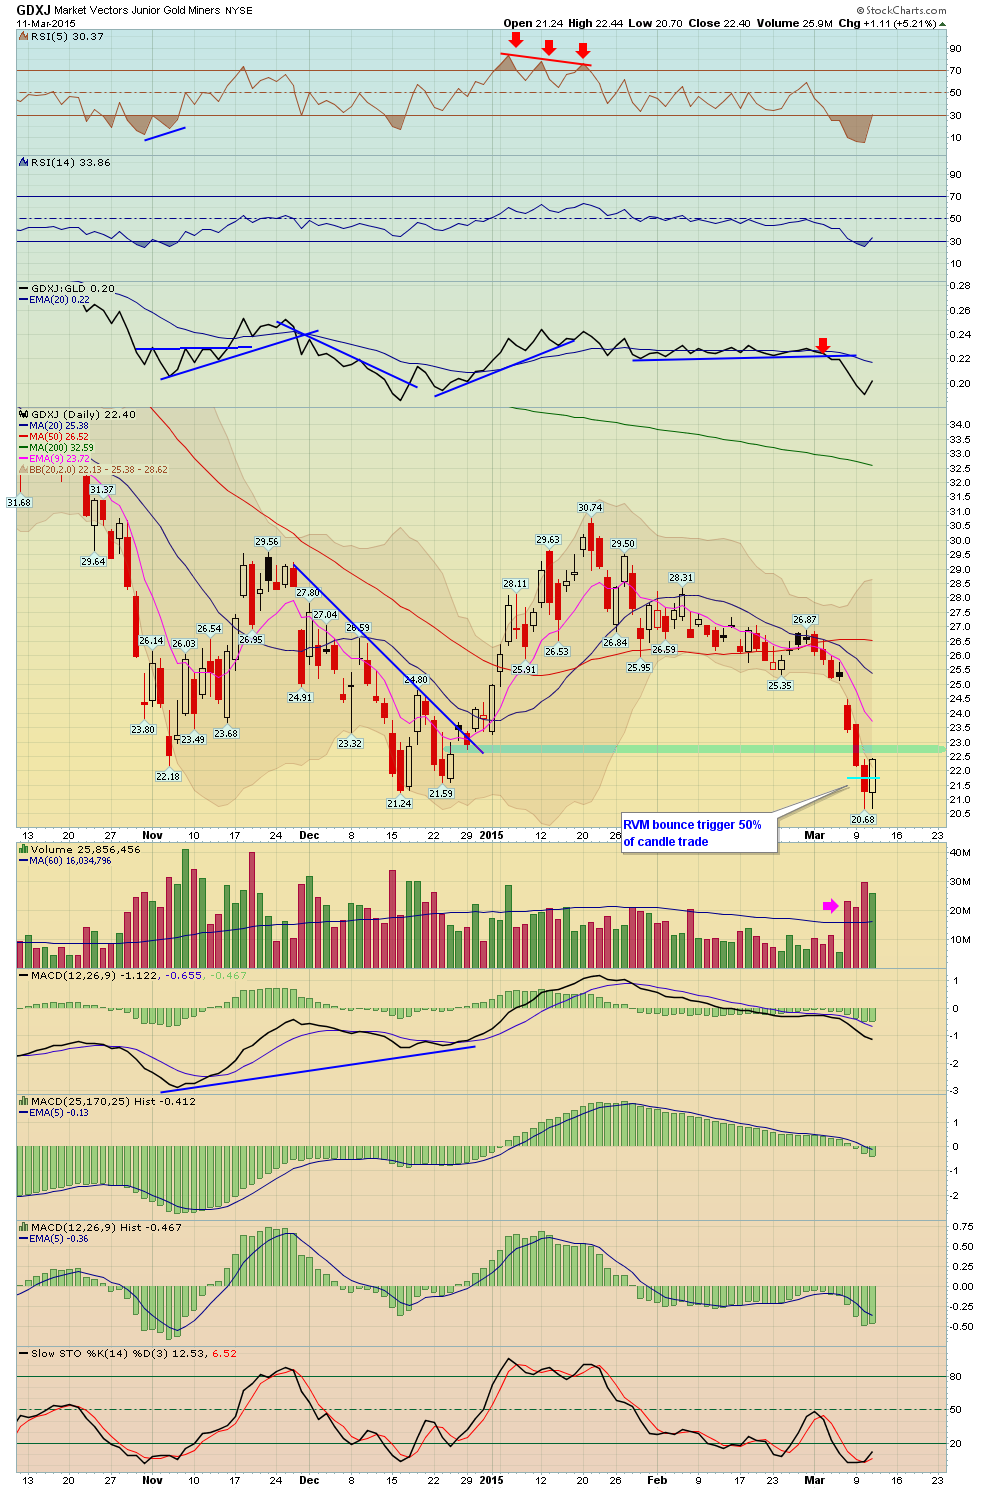
GDX comments
GDXJ - Chart Link - besides the positive divergence and symmetry break on the intra day charts, these charts were setup via the daily charts via a trigger taking back 50% of the candle range a a trigger for those who have watched the tutorials.


The Weekly ETF systems have done great
They sold out of their long positions 2 - 3 weeks ago, most didn't short though XLV is in an exhaustion short