Friday, June 29, 2012

Crude Oil follow up from an earlier post

Crude oil rallied 7 points today!  remember my post from earlier this week on Monday, I said that my thoughts were that crude oil was in a bottoming process, huge rally today up over $7.  The positive divergence finally played out.


Also see the USO chart, which is the crude oil ETF, notice that it rebounded right off support


Here's my post from Monday click here:  

Thursday, June 28, 2012

AAPL Weekly Bear Flag

Here's a weekly chart of AAPL, it has formed what appears to be a text book bear flag pattern; notice how the MACD barely moved during the bounce that formed the flag.  The flag measures to the low $500's, if this bear flag plays out, and AAPL pulls back to the low $500's, then I think AAPL will be a good swing trade long candidate for a year end rally. 

Wednesday, June 27, 2012

Silver is at an important Support area

Silver is at an important support area, click on the two charts that I have provided.  Silver needs to hold this support area, otherwise the door could open for a quick sell off to the 19.5 - 20 area.  However one could also view this area as low risk place to take a Long because your stops can be fairly tight - i.e. buying support.

Tuesday, June 26, 2012

Here's our In-depth Market Newsletter


Hello everyone, here's a link to our in-depth market newsletter.  Please realize that this one is VERY comprehensive, it is over 42 min in length!  However it doesn't simply cover the general market and commodities, there is also a ton of educational material here, therefore please take a look and learn something!  


Also if you like our work, please consider signing up to our paid service, right now our 6 month membership is 50% off our regular monthly price and is a great deal! click here to sign up now


Click Here - for our recent Comprehensive Newsletter


Monday, June 25, 2012

VIX / S&P 500 system and Moon cycle follow up

- The VIX / S&P 500 system also gave a sell signal last week, which as worked out well.  Remember per the rules listed on the chart, the sell signal was generated when the VIX closed below the lower Bollinger Bands and then back inside the bands.  The system has about 90% winning trades.


- Last week I posted the moon cycle chart, as you can see the market has had a healthy pullback since the last cycle.

Crude Oil short term analysis

- Here's an updated daily chart of Crude Oil, the Aug/Oct 2011 bottom is closing it and positive divergence is forming via the two RSI indicators at the top of the chart as well as the MACD.  Bottoming is a process, I think crude oil is in the beginnings of a bottoming process.  Otherwise in the short term the 13 EMA is resistance (green MA)


- The second chart is the ETF USO, the same analysis basically applies.

Thursday, June 21, 2012

Commodities have concerned me for a long time, here's why...

I have been pointing out to our BPT members for a long time now that commodities in general have been severely lagging relative to the general stock market for many months, which has been and is a concern of mine; let's take a look a few charts:


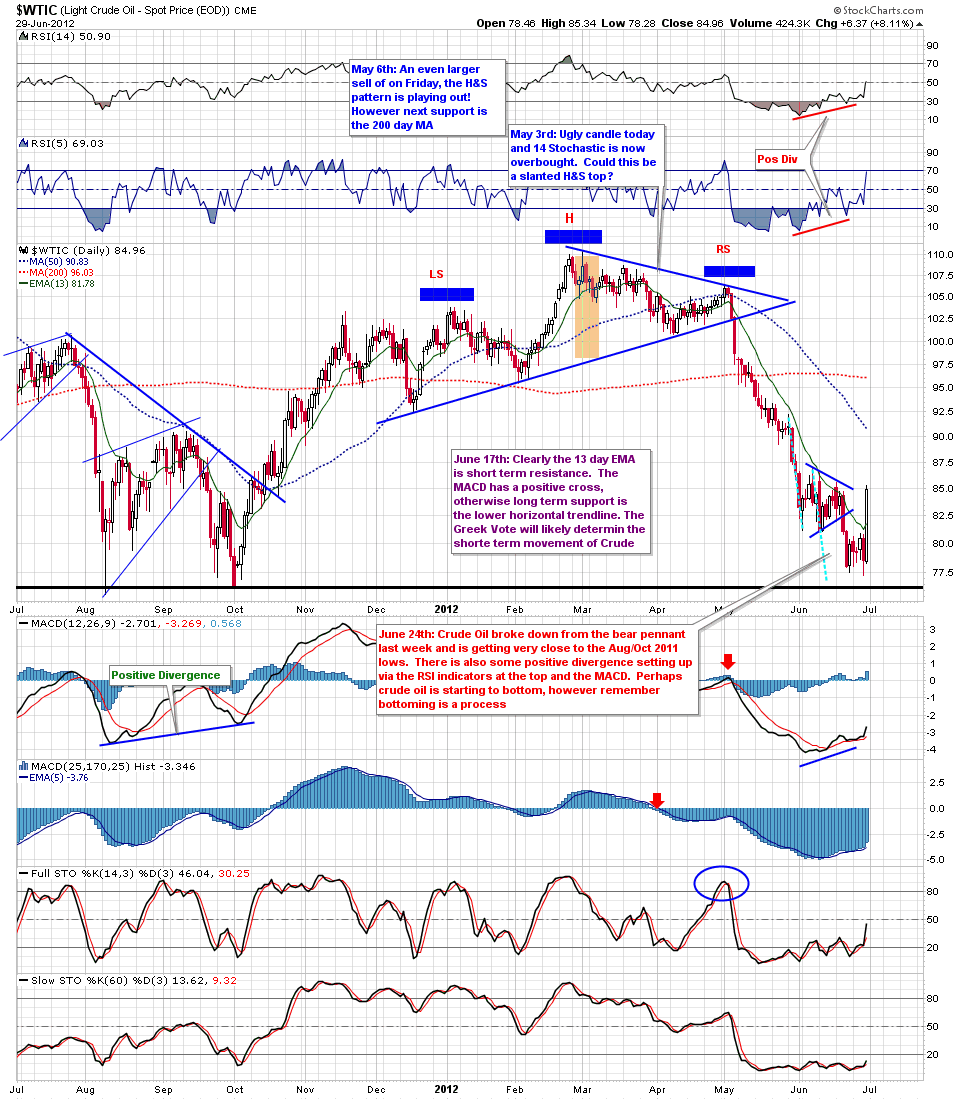
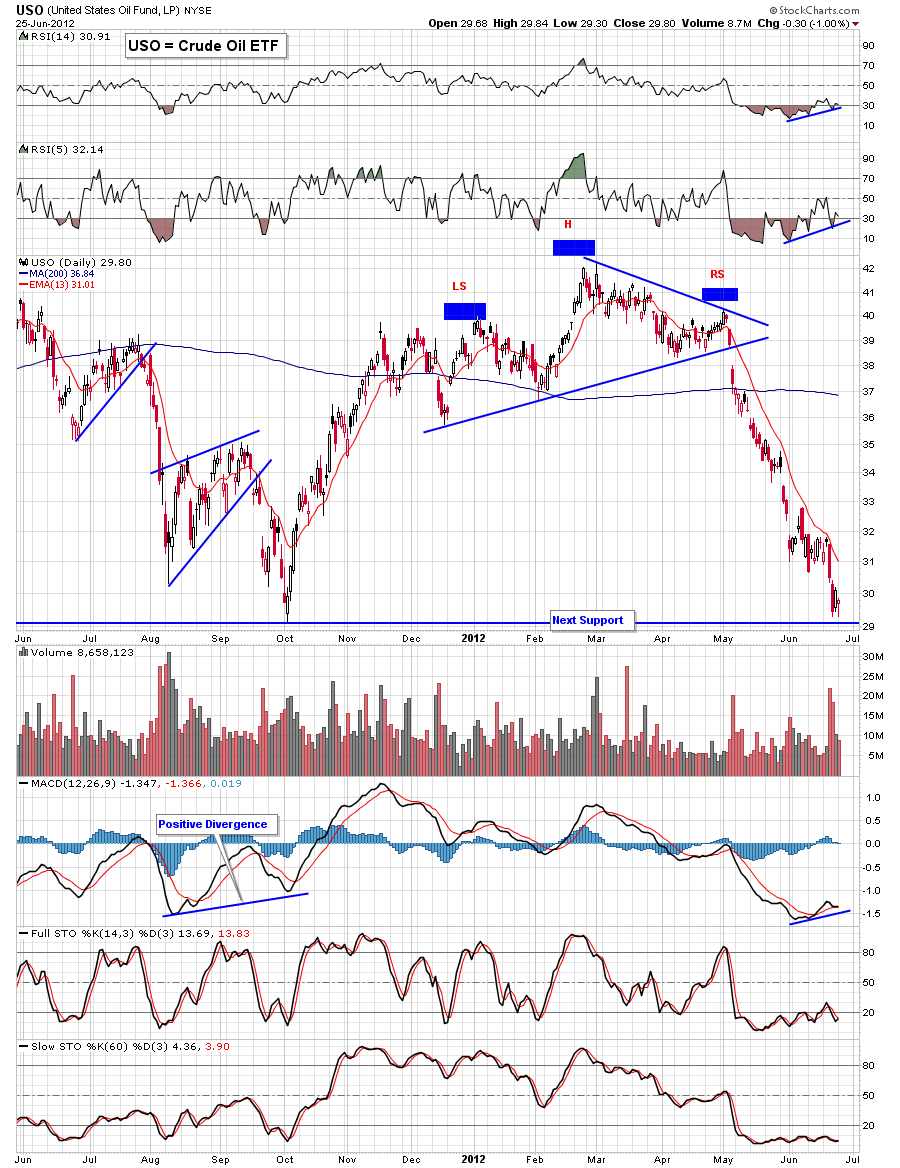
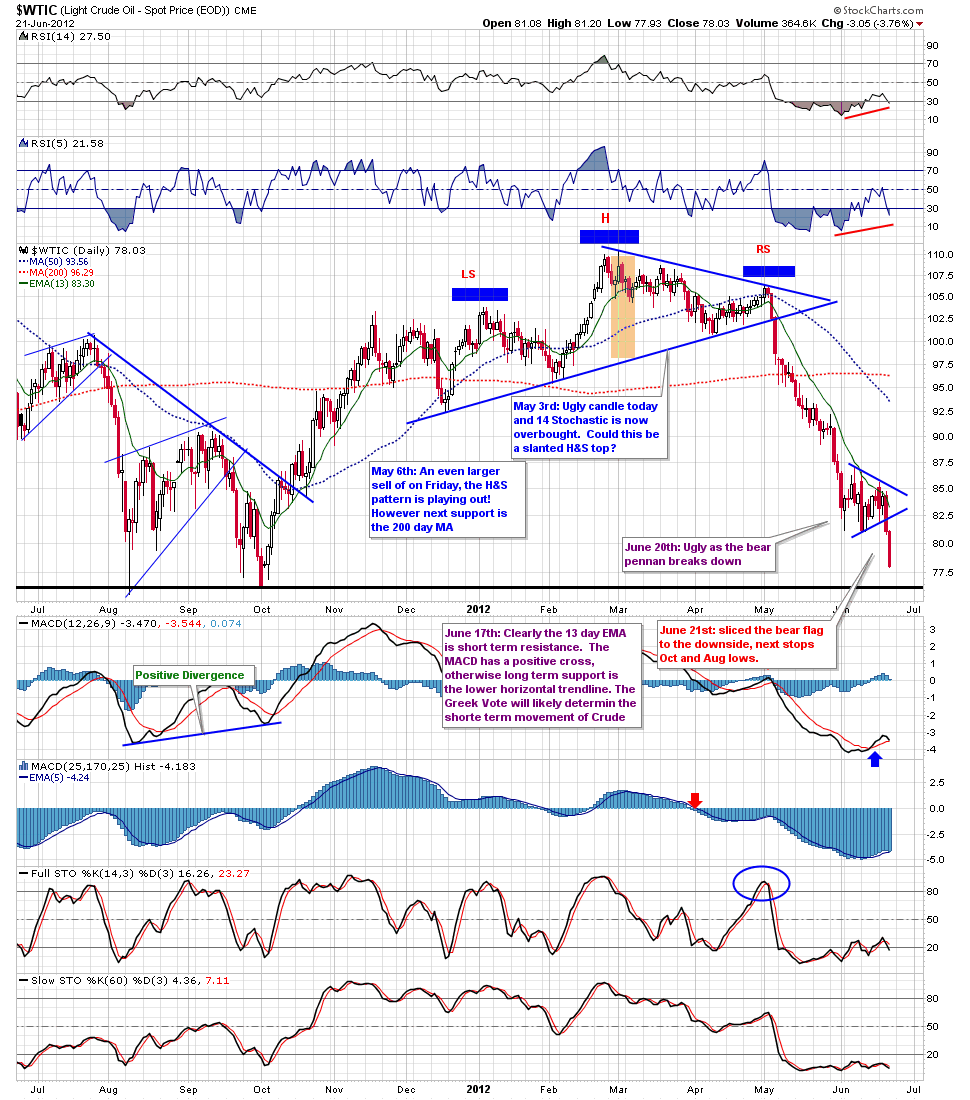
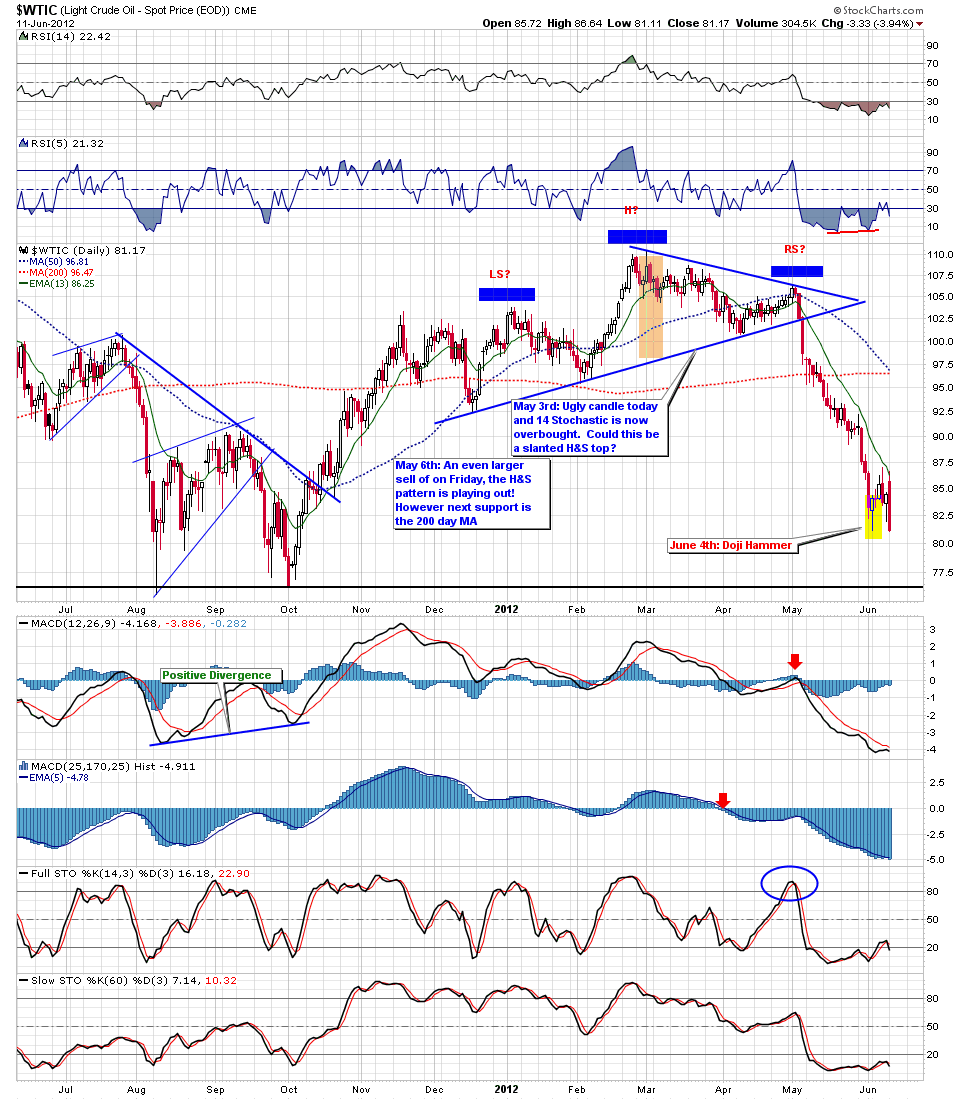
The first chart is a daily chart of crude oil; as you can see it broke down from a bear pennant pattern yesterday and sold off strongly today, the next major support is the Aug/Oct 2011 lows.  Also note the very clear H&S pattern that was in place by April and early May, this was shown to BPT members in April and early May and has more than played out.  Otherwise currently the next major support level is clearly the Aug/Oct 2011 lows marked via the horizontal black line


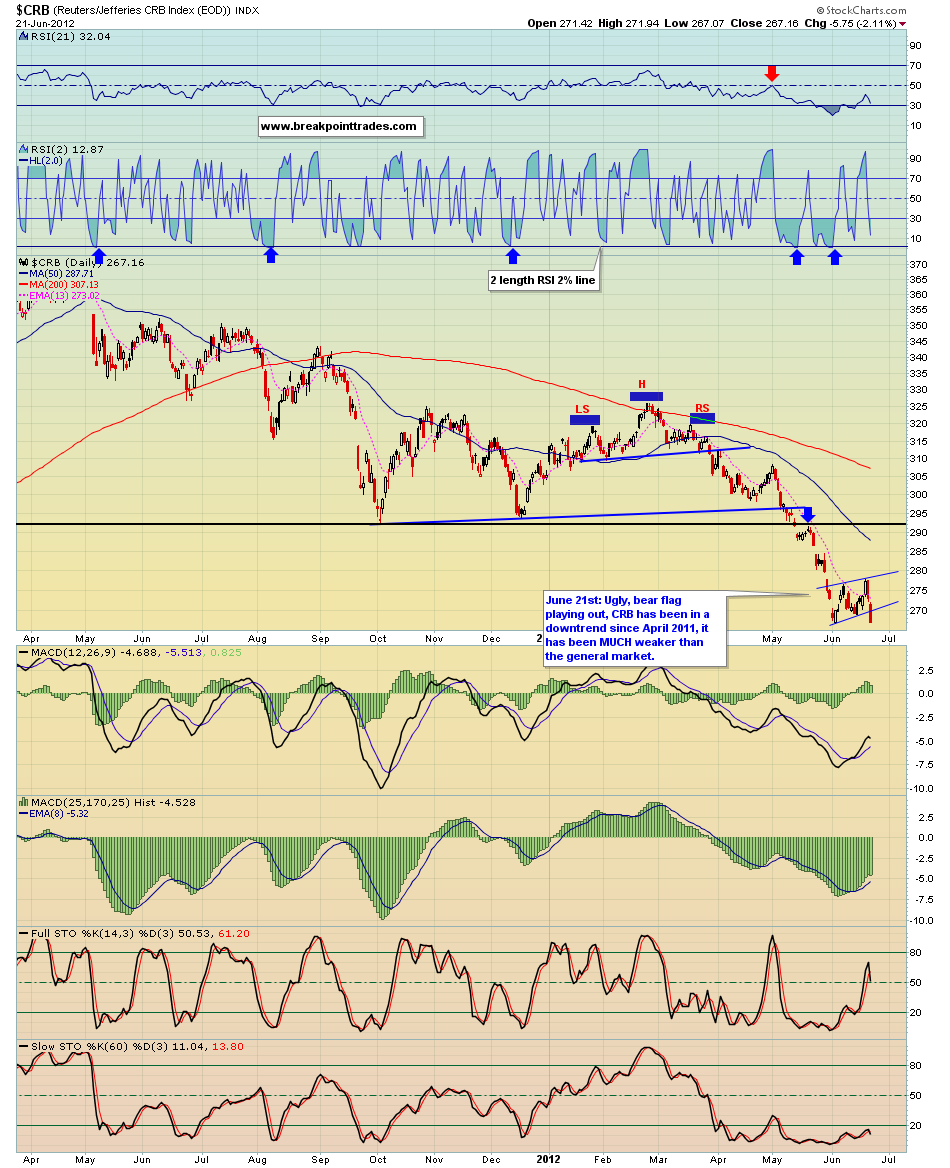
Next here's a daily chart of the CRB Commodities Index which is a composite of 17 various commodities and therefore gives us a broad view of the commodities market in general.  Back in March we pointed out to our members the very clear H&S bearish pattern.  Today the CRB index broke down from a bear flag.  


The last chart shows longer term view of the CRB index.  As you can clearly see, the CRB index has been in a major downtrend since April 2011.  


In short, commodities in general have been MUCH weaker than the general market (Dow/SPX) for a long time.  My major concern is that this is not simply because the US Dollar has been stronger, that's only recently been the case since late April.  My major concern and worry is that the weakness we have been seeing in commodities is being caused by a world wide economic slow down, hence less demand i.e. simply supply side economics.  Anyway this is definitely some cause for concern for the future, maybe we are heading for a world wide recession/depression eventually?  Something to think about.....

Charts follow up, nice pullback!

As you can see, the market pulled back nicely from the Moon cycle, see my previous post from the other day.  


Moon Cycle Chart post


VIX Bollinger Band System Post


Also the VIX sell signal for the SPX worked out great too.  To be fair however, there was a lot of technical confluence there; for example the 1363 high represented a 61.8% Fibonacci Retracement as well

Tuesday, June 19, 2012

VIX Bollinger Band S&P 500 System

Also today the VIX closed back inside the lower Bollinger Band, per the system rules listed on the chart, this represents a sell signal for SPX.  It doesn't tell you how long the trade will last, sometimes a few days, sometimes a major trade, however historically it's been about 90% accurate.  


Otherwise remember that Bernanke speaks tomorrow and we have a FOMC meeting, what he says could spike the market higher or cause a sell off.

Moon cycle chart

Here's a daily chart of the S&P 500 which shows both the full and new moon cycles, I've also covered this chart in the newsletters, you can find it in my weekend newsletter posted below.


Today the SPX closed right on the New Moon cycle date, will this produce a short term top? Possibly, at least lately the these cycles have tended to act as inflection points for the market. 


Also remember that we have a FED meeting tomorrow and what Bernanke says will likely be a big catalyst for the market either causing a continuation of the rally, or decent pullback.  Obviously if Bernanke doesn't make any mention of QE or other stimulus, the market will probably sell off.

Monday, June 18, 2012

Natural Gas Commodity- updated chart with comments


- here's a daily chart of Natural Gas, even though it has a good week last week and follow through today, if this Inv H&S pattern pans out, it could have a long way to run, pattern measurement is shown via the yellow highlighted area via the height of the pattern added to the neckline


However I would be better if Natural gas pulled in soon near the Neckline and formed a higher low (as I show on the chart via the thin blue line), that consolidation would build up energy for a strong push higher.  BOIL is the ETF that we like to trade.


Gold monthly chart with short video discussion


$GOLD - Chart Link - here's the monthly chart of gold that I've shown in my newsletters.  I think it's an important chart going forward, here's a short video explaining what I'm watching, click on the link below to watch the video


http://breakpointtrades.com/jing/2012-06-18_1343.swf


here's the option chain for BOIL, the premiums are very ...

here's the option chain for BOIL, the premiums are very higher


for example one could buy the stock and sell the 39 call strike for $4.1 for a covered call.


If you thought that the bottom was in for Natgas and BOIL, one could sell the 30 puts and still get a buck even though BOIL is trading for over $38, could be free money.   If someone was willing to buy BOIL at $34 on a pullback, you can sell the 34 puts for $2.24, anyway some nice premiums, and if it's put to you not big deal, you were going to buy it anyway.  

Sunday, June 17, 2012

Mammoth Weekend Newsletter


Hello
everyone, this weekend I decided to combine both of our weekend
newsletters (General Market and Commodity) into one mammoth newsletter,
vs having two separate newsletters.  Be warned, there is a lot of detail
here with about 80 charts!


You can view the Newsletter here.


Thursday, June 14, 2012

Newsletter and Special Offer

Happy Friday everyone, here's my detailed newsletter, covering the market, commodities, GDX, and trade ideas.  Also please consider taking advantage of our coupon below, this special offer expires on Friday evening, so there is only 1 day left!!

You can view the newsletter here.

---

**25% Coupon**  Last Day!!! Expires tonight!!

Use this coupon code ( 7ABC0F6217 ) to get an
additional 25% off of our 6 month membership! Please note this offer only applies to our 6 month membership!

Here's how to sign up and receive our special offer: Click on the URL below and you will be brought to your members landing page, select the 6 month membership Special Sale, choose your
payment method, and enter the coupon code 7ABC0F6217, then click on the order button.

**Click Here** To Sign up


Natural Gas follow up

$NATGAS - Chart Link - Awesome move in natural gas today!!  The inverse H&S pattern that I postulated back on June 3rd appears to be playing out with the RS now in place.  


BOIL is the natural gas 2X ETF, buy this on dips, or sell Puts, also start looking at various natural as stocks.  One that is really beaten up that I like is UPL

Natural Gas, Inverse H&S setting up

$NATGAS - Chart Link - here's a daily chart of the Natural Gas commodity, after putting in a 5th wave divergent low in April and enjoying a nice rally, this pullback appears to be forming a RS of an Inverse Head and Shoulder Pattern.  ETF's for Natural gas are BOIL and UNG

Tuesday, June 12, 2012

Most Recent Newsletter

Hello everyone, here's my most recent newsletter, there's a lot people wondering what the market is going to do in the short term and for the rest of the year, I discuss my thoughts in detail.  I also discuss commodites, precious metals, and give you a list of trade ideas.

**Click Here For the Newsletter


Also, our 25% Sale ends this Friday, therefore please consider taking advantage of our sale and buy a BPT membership while you can before it expires!

**25% Coupon** off a Breakpoint Trades Membership!

Use this coupon code ( 7ABC0F6217 ) to get an additional 25% off of our 6 month membership! 


GGN ex dividend date is tomorrow Wed June 13th

GGN is a closed end gold fund and it pays a $0.14 cent monthly dividend , which is close to 11%.  The management sells covered calls against their long positions and pays this in a monthly dividend.  Obviously GGN took a hit in May with the weakness in gold and gold stocks and has finally reached a support area.  

However I apologize, yesterday I mistakenly stated that you could buy GGN today (June 13th) and still receive the dividend, that is incorrect, the ex dividend date is today.  However this is not a big deal because remember GGN pays monthly and the next ex dividend date is July 14th, which means you buy it later this month or next month and receive the next dividend. 

This might be best because I think the chart still needs some work i.e. consolidation, via the way the chart looks I would not be surprised to see GGN still near the current prices or even slightly lower a month from now.  Therefore let's revisit GGN at a later date

Again I apologize for the confusion yesterday :)

Monday, June 11, 2012

Euro Currency Analysis

FXE - Chart Link  Daily Euro - text book technical analysis; first off the Euro broke down from the descending triangle in early May, then it took out Jan lows, then it bounced last week from some positive divergence via the RSI's and Histogram, and today it logically stopped exactly at previous support, which became resistance. 


FXE - Chart Link 60 min Euro, as you can see the Euro bounced last week however the bounce could be setting up a bear flag

Crude Oil

$WTIC - Chart Link - After a short bounce last week from the Doji hammer candlestick crude oil reversed once again at the 13 day EMA, which is clearly strong resistance. 


Major support is below via the Aug - Oct 2011 lows

Wednesday, June 6, 2012

VIX Bollinger Band S&P 500 Mechanical System

$VIX - Chart Link - Here's a system that we've been using at BPT for the last few years, it involves using Bollinger Bands on the VIX.  The system gave a buy signal on June 4th on Monday, and clearly this has provided a nice bounce!  The system gives about 90% winning trades.  The rules are listed on the chart.  


The signal was triggered on Monday via a close of the VIX back inside the upper Bollinger Band.  Last Friday the VIX closed outside the Bollinger Band and was your trigger to watch for a close back inside the upper band to provide the trigger, which of course occurred on Monday.

Monday, June 4, 2012

Monday June 4th, 2012 Newsletter

Here's our Monday Newsletter, also please consider taking advantage of our sale currently going on where you can get 25% off a Breakpoint Trades membership.


Monday June 4th, 2012 Newsletter

Examples of some of our recent trade shorts

SPY - Chart Link - Here's a great example of one of our swing index shorts from our watchlist, this is a chart of the SPY (S&P 500 ETF), clearly this H&S pattern has played out well

CFX - Chart Link - Here's another example of a short from our watchlist, see my comments on April 30th regarding a low risk short of a H&S pattern.  Clearly this H&S pattern has played out well.

SRS - Chart Link - Here's the Inverse Short ETF that was added to our watchlist on May 22nd looking for form an inverse H&S pattern, clearly it has played out

CBG - Chart Link - Here's another example of one of our Short ideas added to our watchlist on April 30th, clearly this H&S pattern has provided a nice trade.

This is just an example of some of our trade ideas.  We went bearish on the market in mid April and have been on the right side of the market.


NEM Weekly RSI Chart Update

Back on May 17th, I posted this weekly 20 year chart of NEM with the RSI indicator set to a standard 14 length.  


Here's a link to the May 17th Post


As you can see from the chart, over the past 20 years, whenever the weekly RSI become oversold, a bounce always occurred in NEM.  Sometimes it simply produced only a short term bounce in a major downtrend (see the late 90's, while other times it signaled major bottoms, however it has always provided a trade and this last time was no exception. 

Sunday, June 3, 2012

Weekend Newsletters - General Market and Commodities


Hello everyone, here's our two weekend newsletters, one on the general market and the other one on commodities. 


Also please consider taking advantage of our membership sale price


1. General Market Newsletter, June 3rd 2012


2. Commodity Newsletter June 3rd, 2012


Friday, June 1, 2012

Gold Stocks discussion

In the post below I show a follow up to your GDX Renko Mechanical System which is now up 12%! Here's a link to that post


Otherwise let's take a look at the Gold Stock Indexes and ETF's


$HUI - Chart Link - The first chart shows a weekly chart of the HUI gold bugs Index, as you can see it bottomed exactly at the measured move of the pattern.  This is a chart that we discussed in early May in our Newsletters.


GDX - Chart Link - The second chart shows you a 60 min chart of GDX (gold miners ETF) as you can see there was a well-defined inverse H&S pattern, on the chart I show the price targets to this pattern.  Also notice that the broken downtrend line held as support on the pullback earlier this week.  


GDX - Chart Link - The third chart shows a daily chart of the GDX, as you can see the broken downtrend lines gave nice long entries - especially the GDX/GLD ratio trendline.  Notice how the pullback earlier this week found support exactly at the broken downtrend line, that was a low risk buying opportunity.  Also as far as an Elliot Wave count this move off the lows is either an ABC with today's move being wave C, or a more bullish 5 wave uptrend with today's move as the start of wave 3.


Please consider signing up to BPT to our newsletter service to see my detailed thoughts going forward on gold and previous metals, as well as the general stock market etc.

Gold stocks and GDX Mechanical System

GDX - Chart Link - here's a follow up to my GDX swing system post from below.  Clearly the system is doing quite well, the system trade is now up 12%!! Also the profits are protected with the stop now being moved up to 44.73.


Gold metal had a big reversal today after the very weak jobs numbers were posted as there is hopes for QE and countries having to inflate themselves out of this financial mess. Obviously gold stocks are benefiting and we started focusing on them in early May.