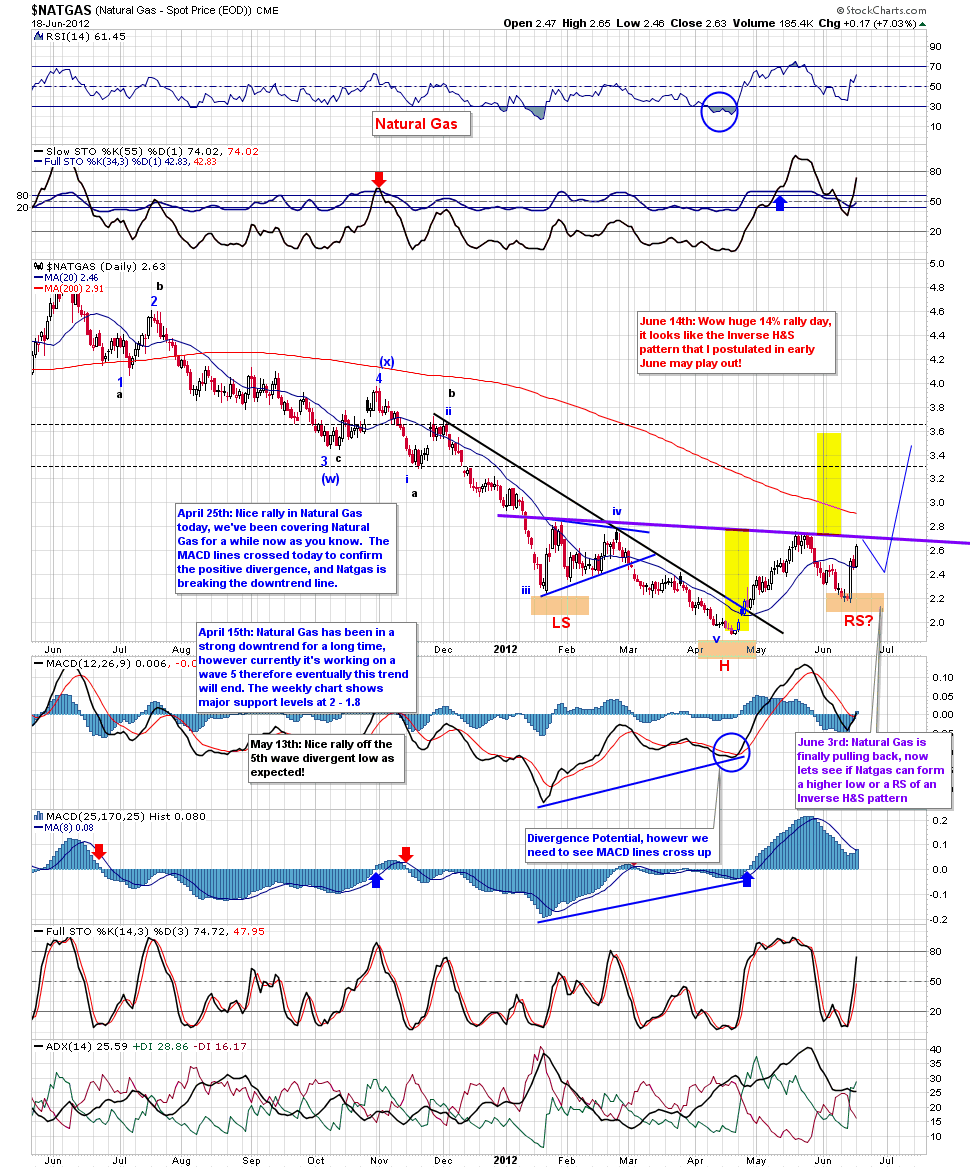
- here's a daily chart of Natural Gas, even though it has a good week last week and follow through today, if this Inv H&S pattern pans out, it could have a long way to run, pattern measurement is shown via the yellow highlighted area via the height of the pattern added to the neckline
However I would be better if Natural gas pulled in soon near the Neckline and formed a higher low (as I show on the chart via the thin blue line), that consolidation would build up energy for a strong push higher. BOIL is the ETF that we like to trade.
No comments:
Post a Comment