In the post below I show a follow up to your GDX Renko Mechanical System which is now up 12%! Here's a link to that post.
Otherwise let's take a look at the Gold Stock Indexes and ETF's
$HUI - Chart Link - The first chart shows a weekly chart of the HUI gold bugs Index, as you can see it bottomed exactly at the measured move of the pattern. This is a chart that we discussed in early May in our Newsletters.
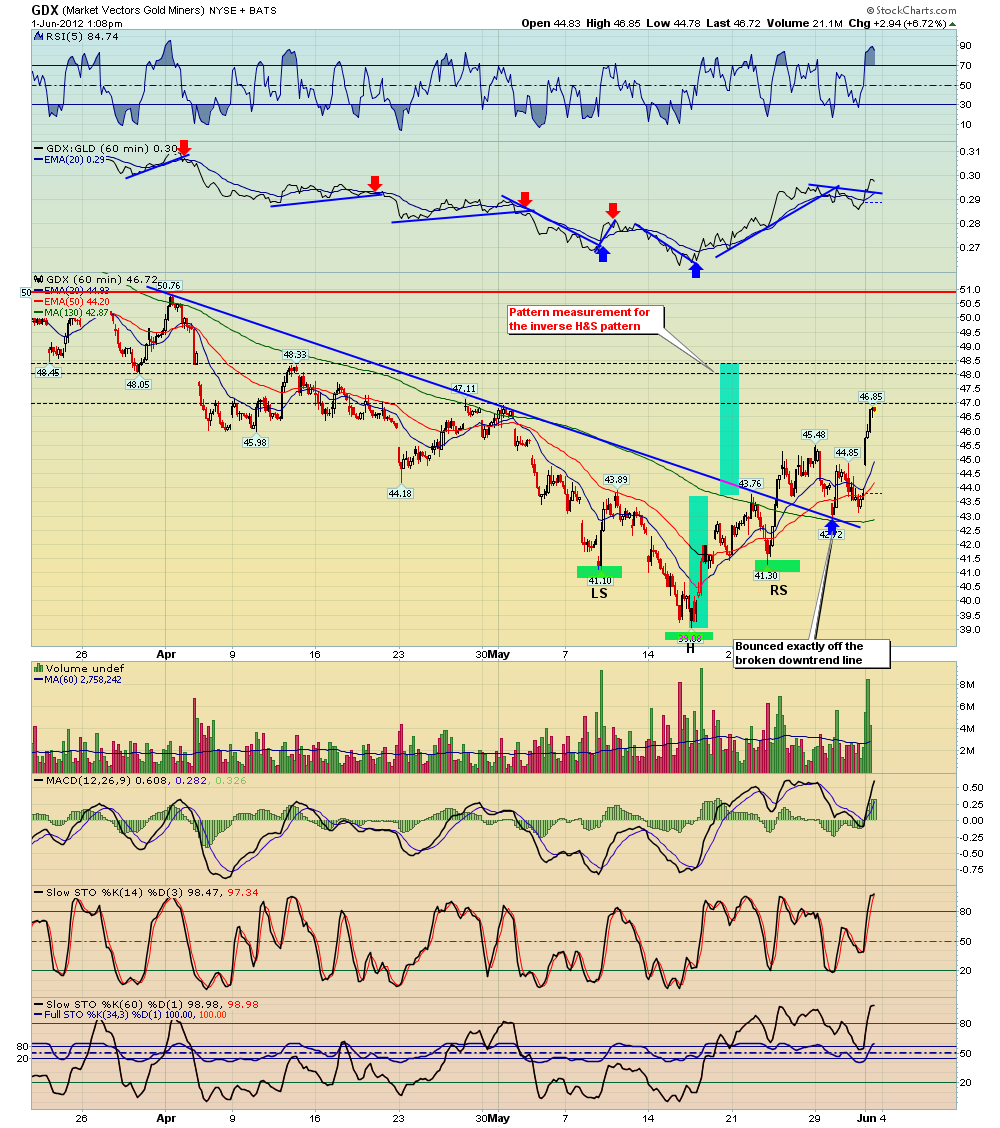
GDX - Chart Link - The second chart shows you a 60 min chart of GDX (gold miners ETF) as you can see there was a well-defined inverse H&S pattern, on the chart I show the price targets to this pattern. Also notice that the broken downtrend line held as support on the pullback earlier this week.
GDX - Chart Link - The third chart shows a daily chart of the GDX, as you can see the broken downtrend lines gave nice long entries - especially the GDX/GLD ratio trendline. Notice how the pullback earlier this week found support exactly at the broken downtrend line, that was a low risk buying opportunity. Also as far as an Elliot Wave count this move off the lows is either an ABC with today's move being wave C, or a more bullish 5 wave uptrend with today's move as the start of wave 3.
Please consider signing up to BPT to our newsletter service to see my detailed thoughts going forward on gold and previous metals, as well as the general stock market etc.


No comments:
Post a Comment