Thursday, August 27, 2015

Value line monthly chart

Value line monthly chart

$XVG - Chart Link - boy this chart certainly played out, forgot about it, showed early this year, it had only formed a minor high over the 2000 and 2007 highs, unlike the SPX and Dow which greatly exceeded them, and had a nice wedge with divergence to boot

Tuesday, August 25, 2015

TLT Daily

TLT Daily

TLT - Chart Link

Downside follow through after yesterday's reversal candle..

Monday, August 24, 2015

NYMO- Closed a second day below the lower BB's


NYLOW Extreme Levels, Above 2011 lows

$NYLOW - Chart Link - see it compared to Oct 2014, no contest
$NYLOW - Chart Link - see it compared to the 2011 lows, above that even

Sunday, August 23, 2015

BPT Free Weekend Market Newsletters

Hello everyone, I hope you had a nice weekend, as you know last week the market took a major beating, but those of you who have been actively following the charts won't be surprised as many warning signs have been abound in the charts all year.  Here's both of my weekend newsletters with my analysis and thoughts.  Also consider taking advantage of our 25% off coupon.
CLICK HERE to view the General Market Newsletter
CLICK HERE to view the Commodity Weekend Newsletter


Also make sure to bookmark my Twitter page CLICK HERE where I post charts, market analysis, and trade ideas all week.


enjoy the rest of your evening and let's see how this puppy plays out this week!

-Matthew Frailey

SPX Weekly Views (Support Levels)

SPX Weekly Views (Support Levels)

$SPX - Chart Link - Key will be what China does (if anything) on Sunday Night 

Friday, August 21, 2015

SPX Daily Tagged the 50% Fib Retracement Level


ES Reversion to Mean Setups


Nice trades on the RVM setups on ES. Here's example on the 10 min ES, trigger long was 50% of the down candle, the target at the 9 EMA was 6 1/2 points.  


Thursday, August 20, 2015

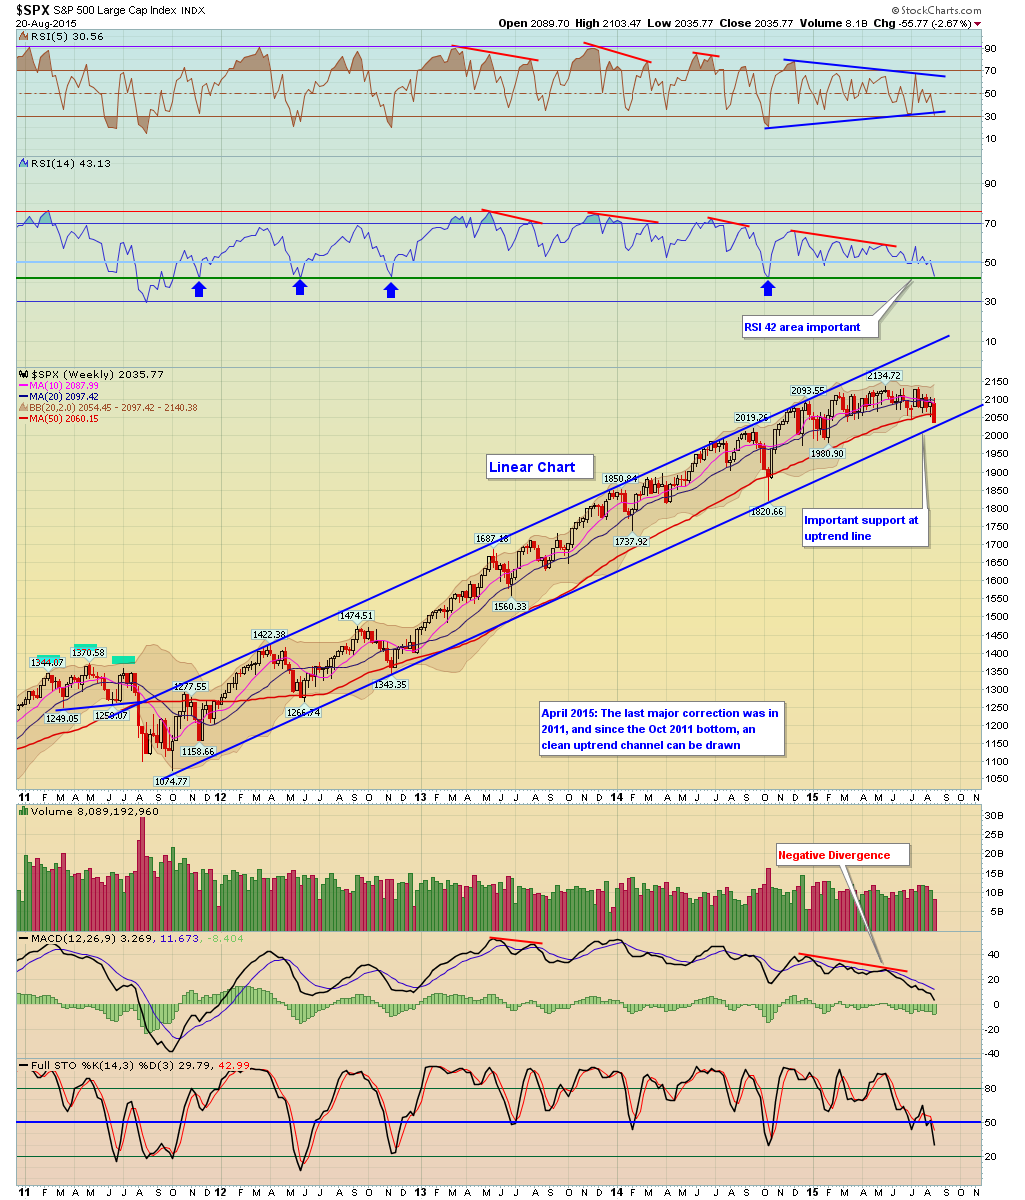
SPX Weekly


Close to the channel trendline again.  Also look at the 14 RSI line, look at the triangle on the 5 RSI.  


could this part of that dreaded wave 4, 20% correction?  


Tuesday, August 18, 2015

GDX Daily


                     Bounced off 9 day EMA again today after moving into yesterday's gap


Tuesday, August 11, 2015

BPENER Renko Flipped to a Buy


don't expect a huge return on this after the last short - typically after such a move, the next move is more prone to either a small gain or a whipsaw


Friday, August 7, 2015

BPGDM Comments

I had a question in my messages the BPGDM if GDX moves up when will this move up.  
Remember how these bullish percent charts work, they are based on point and figure charts (old school charts for your Grandpas).  All the stocks are on P&F sell signals, it may take a while before one of these goes on a P&F buy signal.  I have to look and see how far the stocks are away, which one is the closest out of the group - however it could be a while.


Thursday, August 6, 2015

Other Trade Type

Here's a different trade type, the RVM trades are against the trade i.e. bounce plays in downtrends or pullbacks in uptrend, but they are are against the trend. So while the RVM setup occurred a couple times on ES trade the market has continued selling off after each minor bounce.
here's a workspace I use to play the trend, these ES chart are range are set up as range bars, basically what I do is observe the exponential moving average configuration and when they expand (which Steve and I already talk about all the time anyway), I can enter a trade when price goes back to those MA's, generally I use the 34 or 50 EMA.  
here' you can see how price bounced back to the yellow 34 EMA and reversed, that was a low risk short.   There was also another short previously
I also like to observe the other indicators below: 
- notice the BPT BR Squeeze indicator came back to zero and reversed there
- BPT_DS stoch and RSI accum indicators got overbought and reversed.


Monday, August 3, 2015

Nice ES RVM trade setup at the lows, here's an educational chart


see the comments on the chart, entry was 2092.5