Monday, November 30, 2015

GOOGL followup to previous post, leaking some oil now, if you are short, monitor the 20 MA here


AMBA long idea follow up, posted this morning, nice breakout from the trendline/neckline


SGY long idea, another energy play, coiling into a tight triangle off MA support


DVN long idea from newsletter, energy play monitoring trendline here


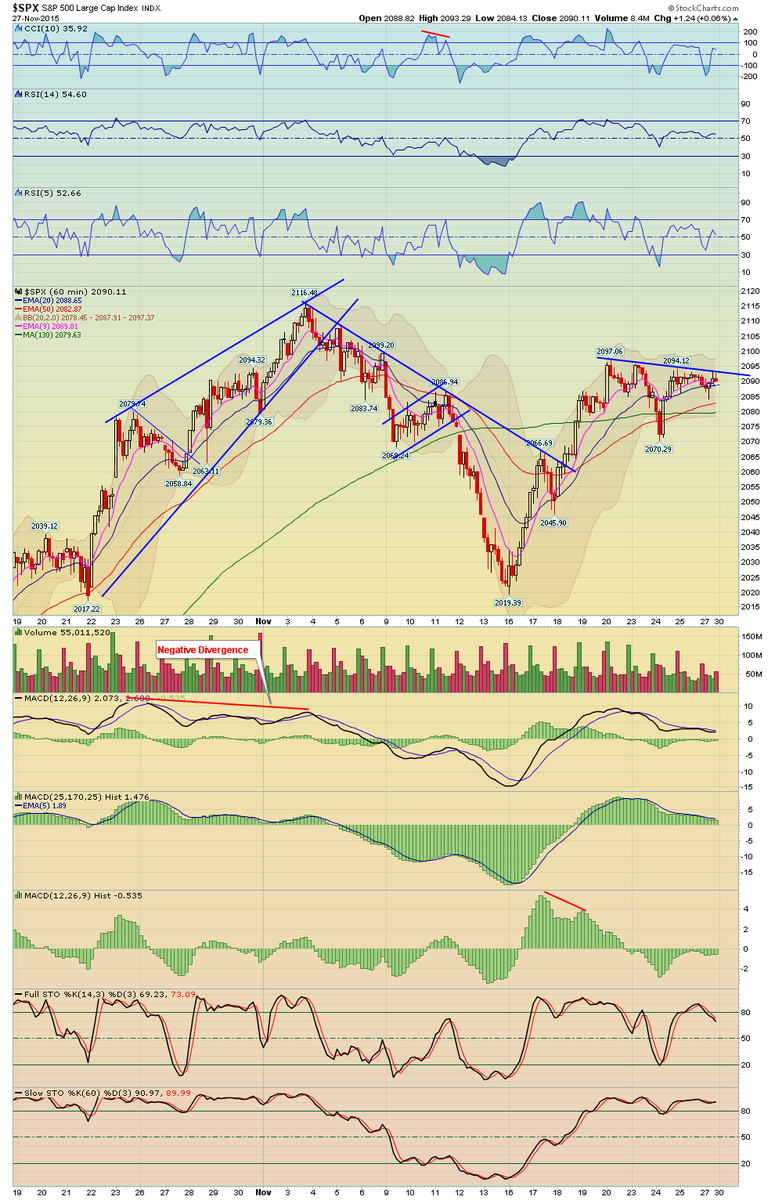
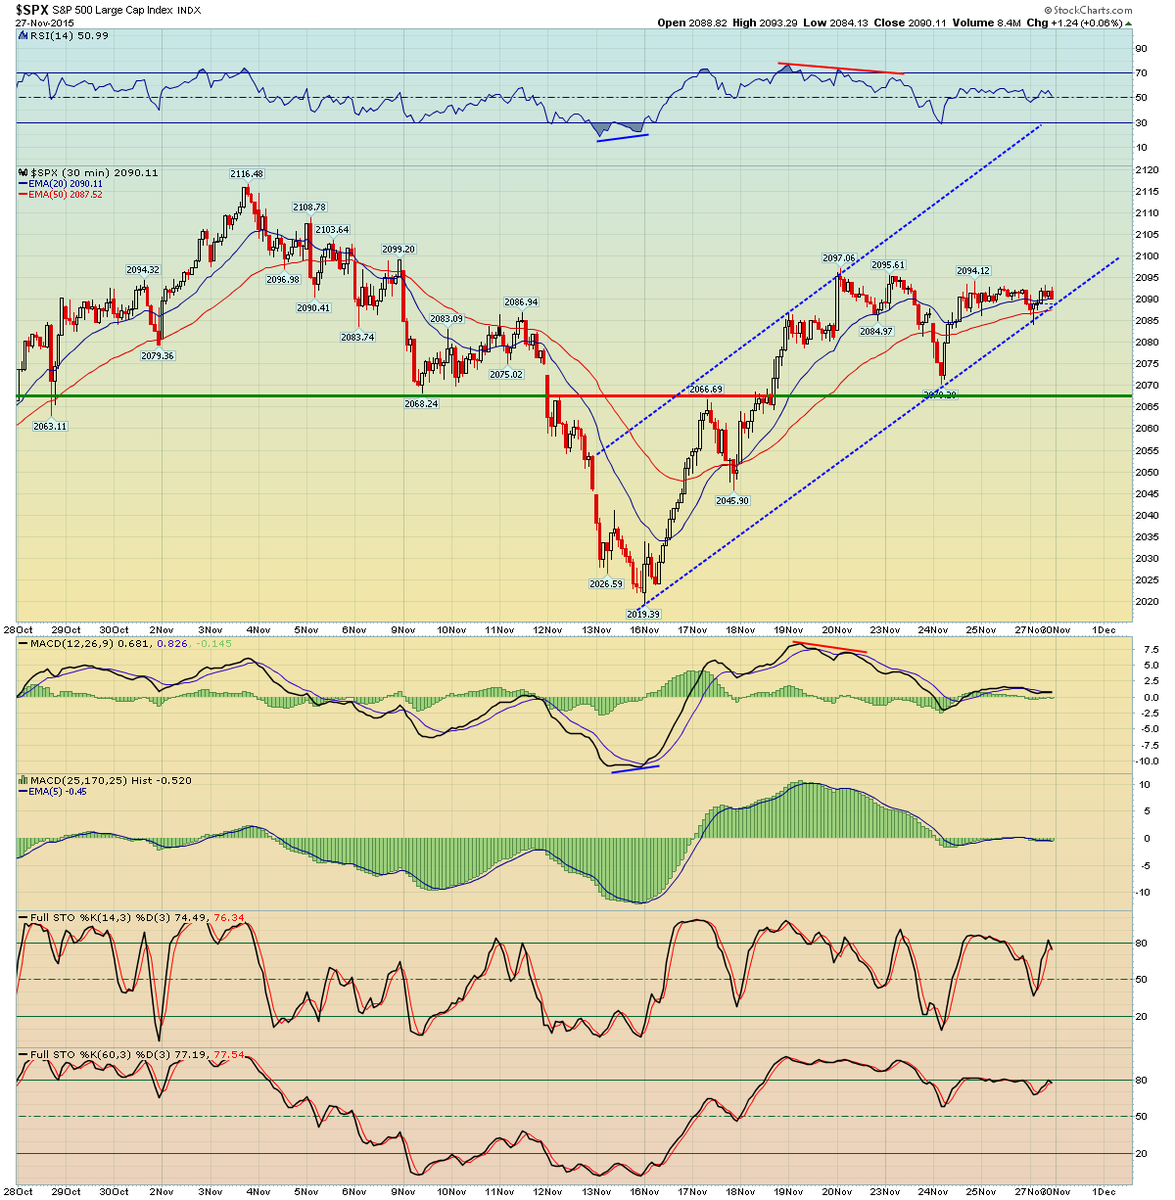
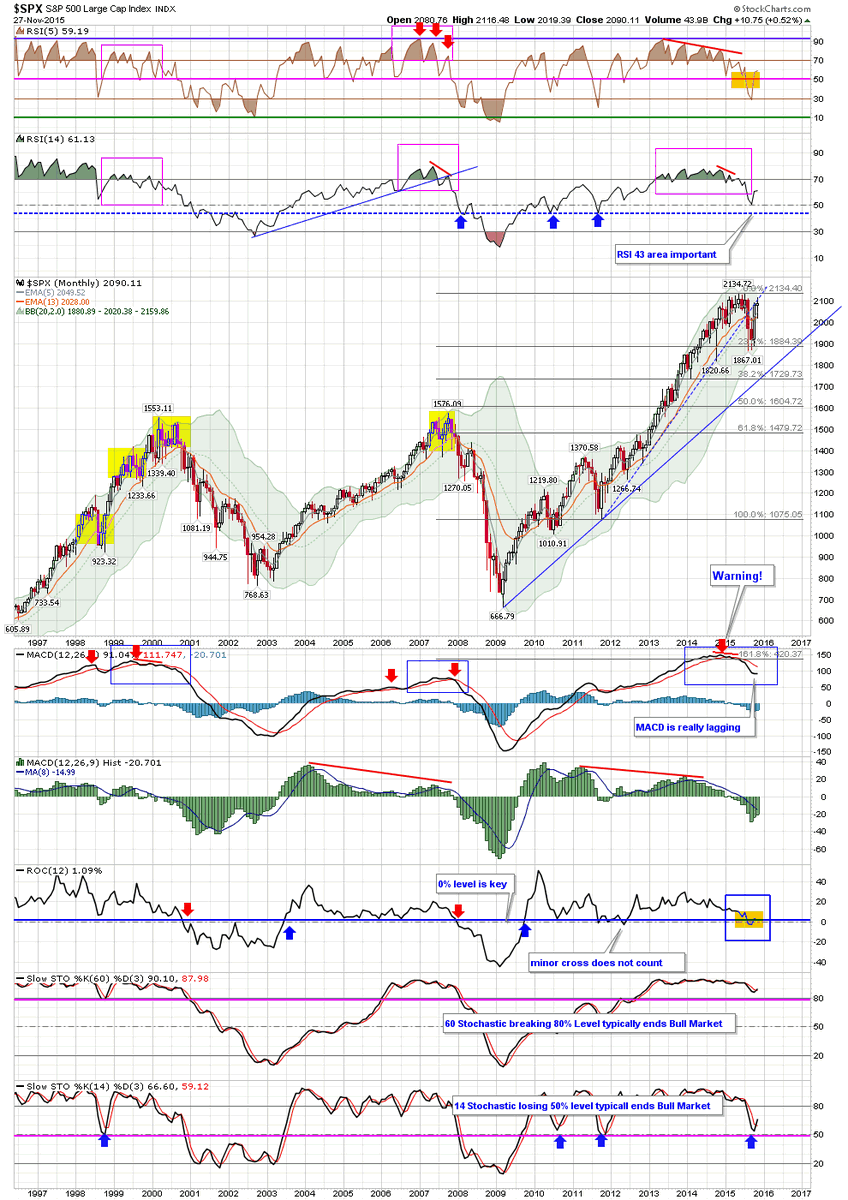
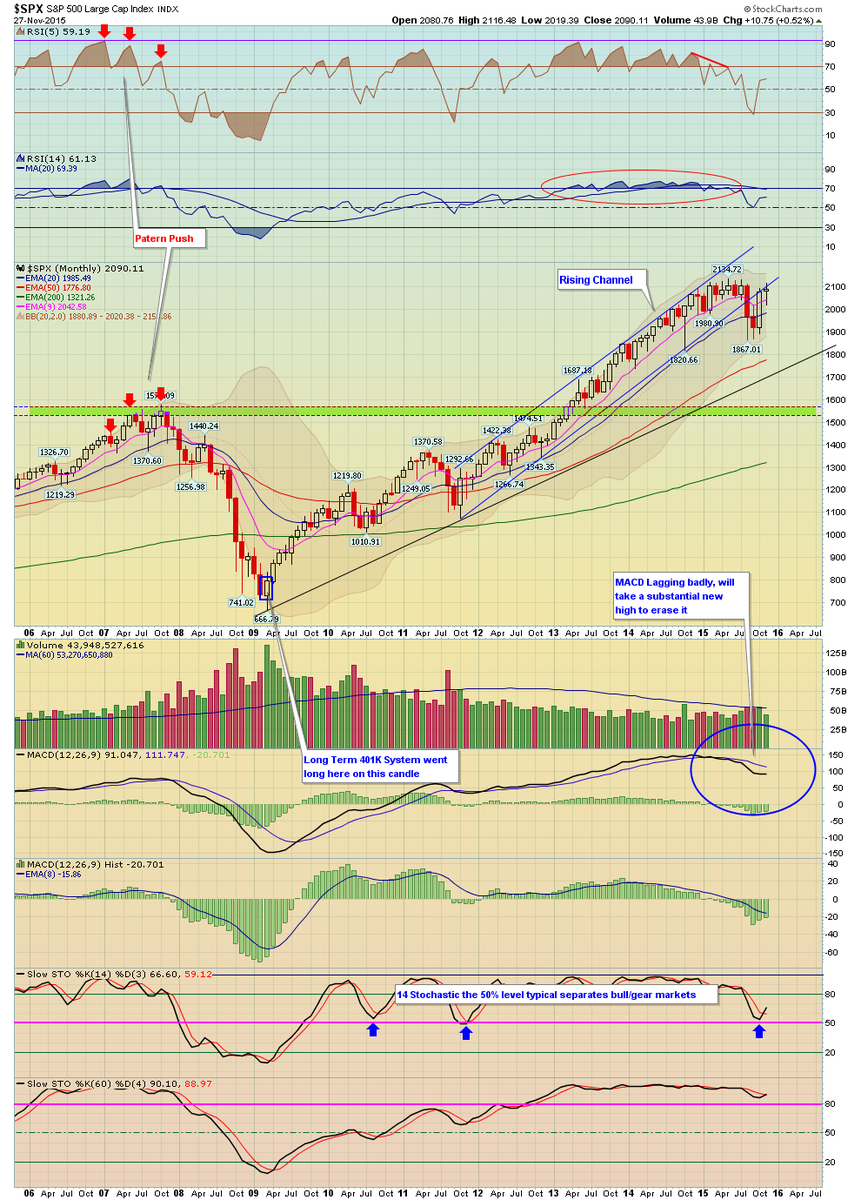
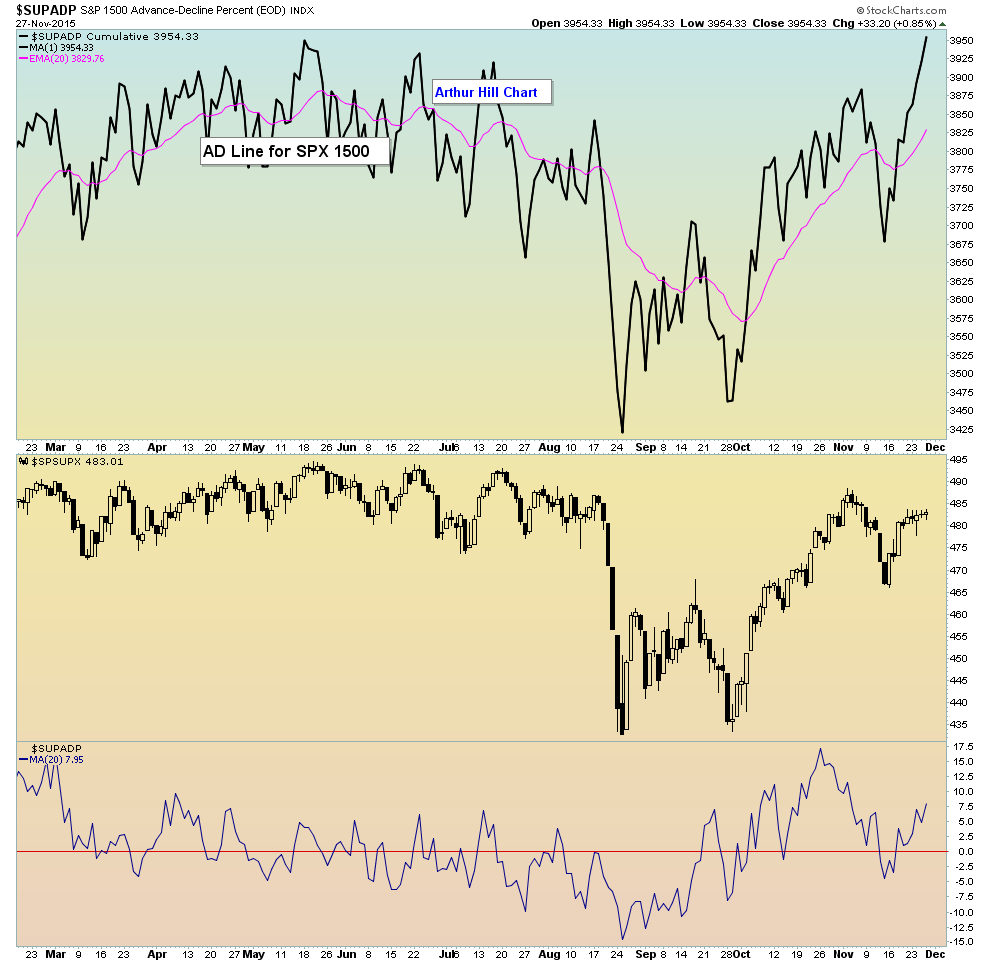
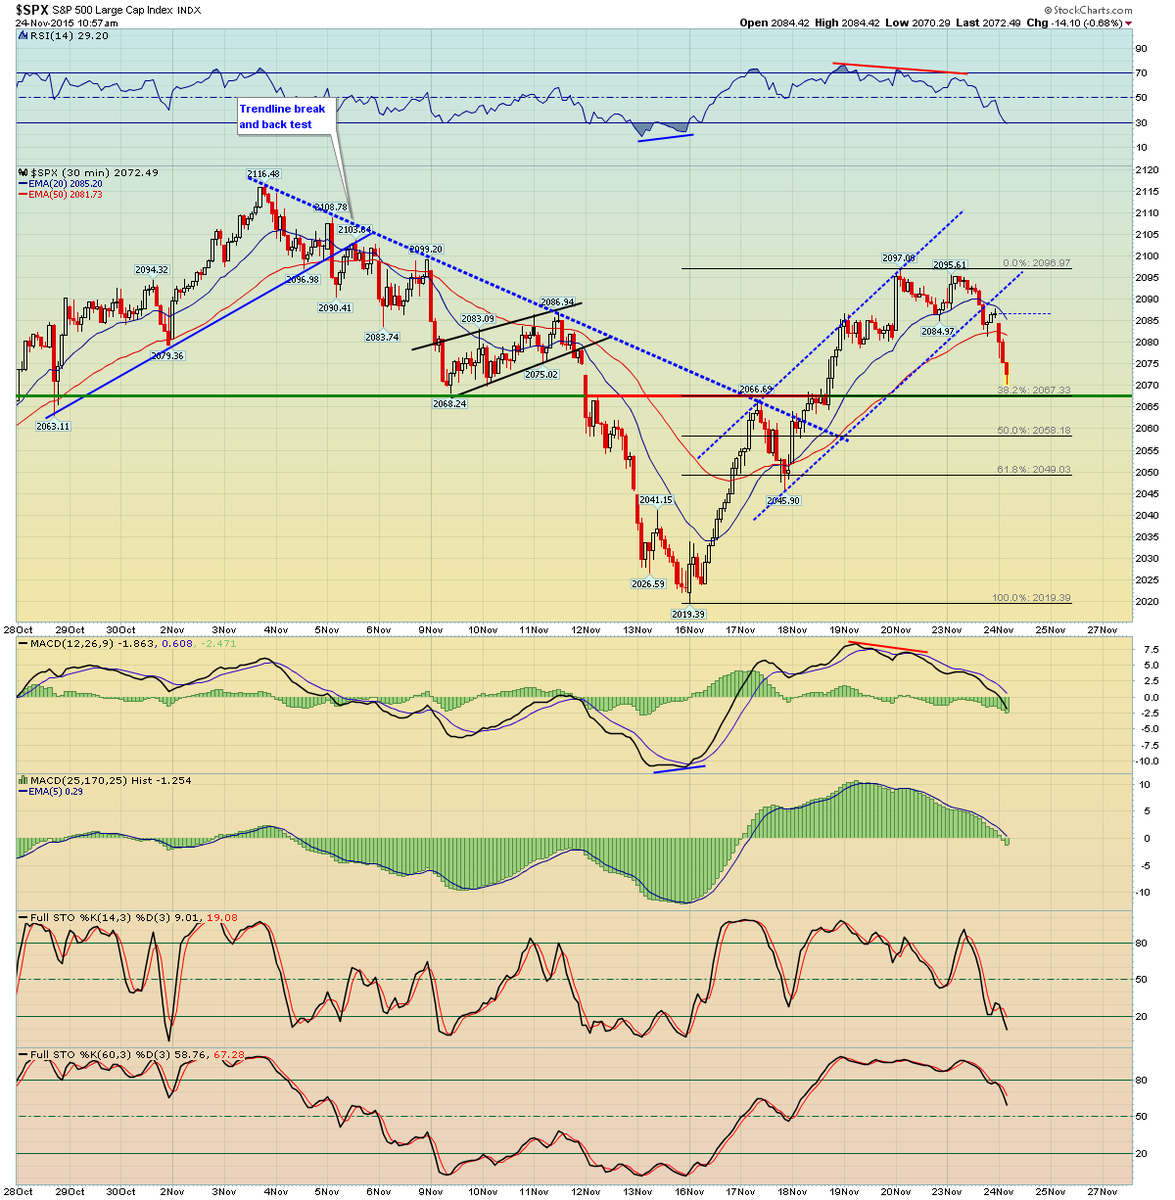
November 29, 2015 Weekend General Market Newsletter- Free

And here's my very comprehensive general market newsletter, again best viewed on a desktop computer

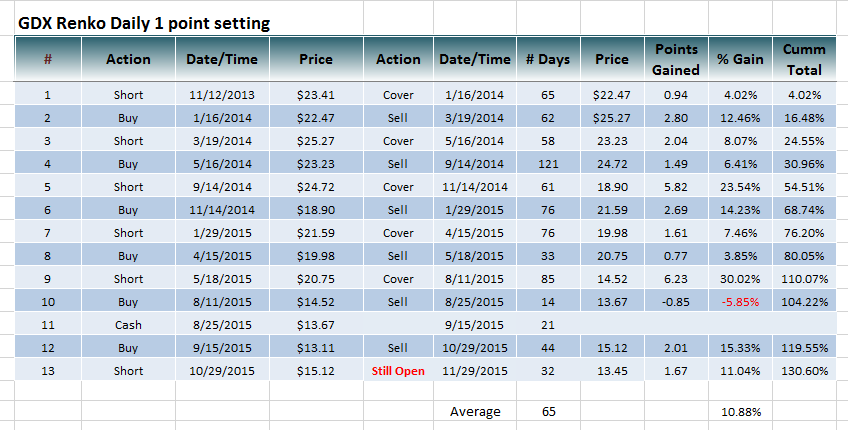
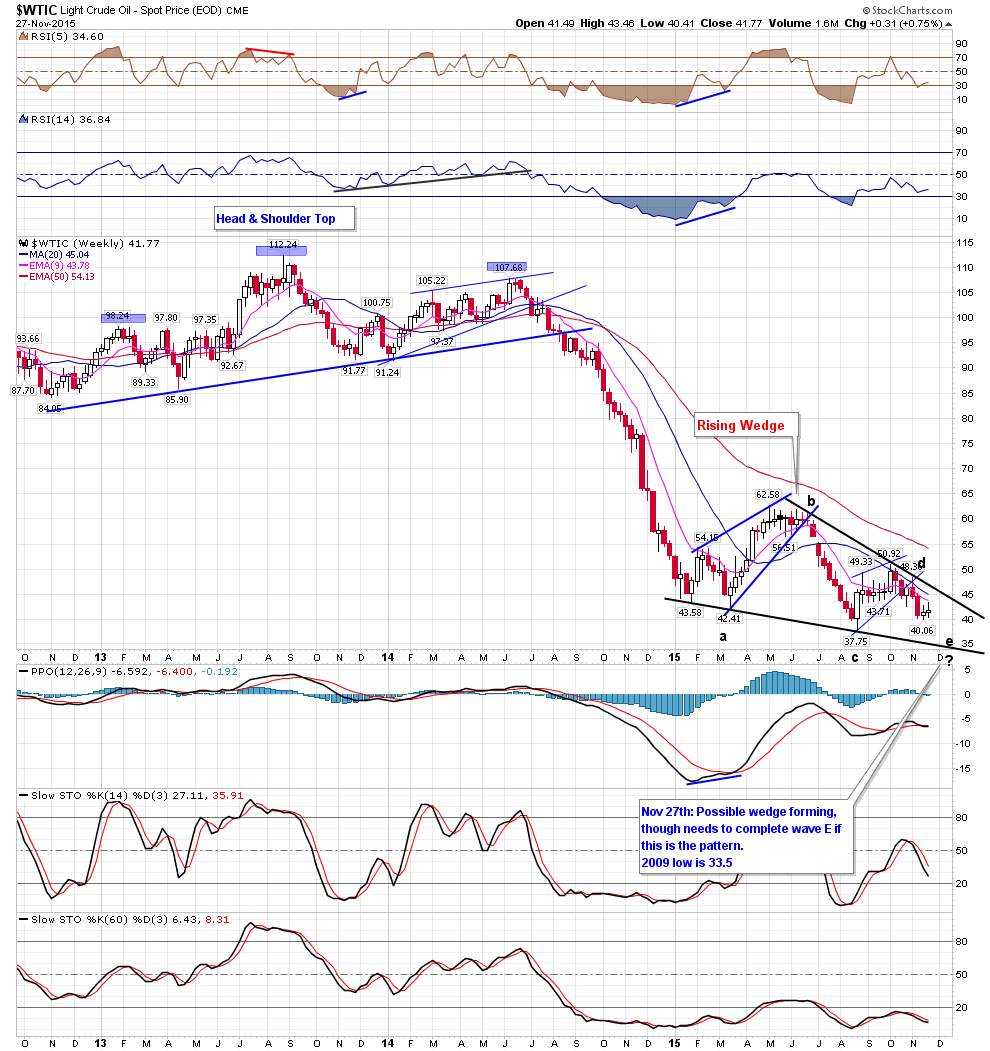
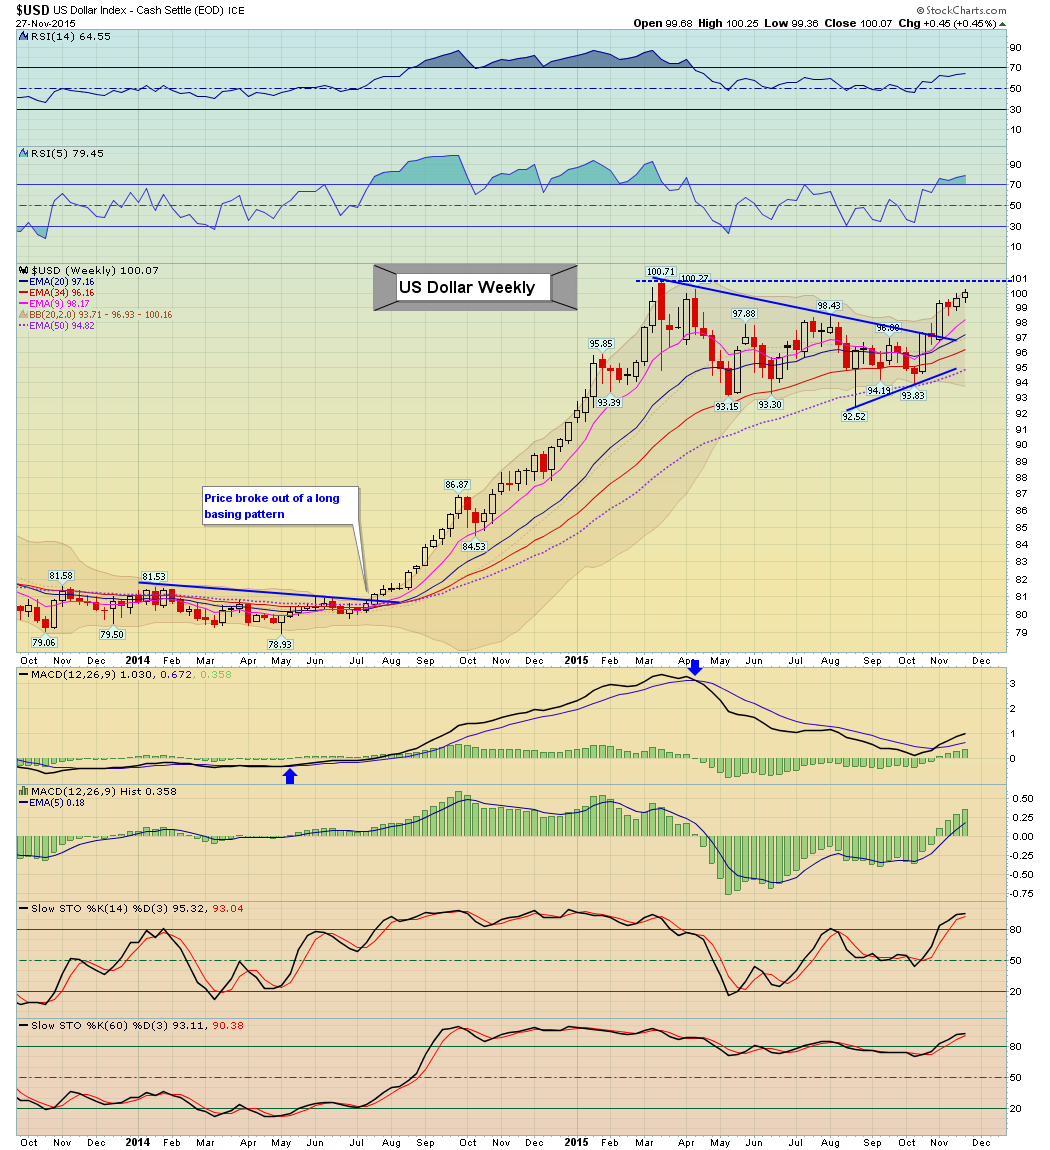
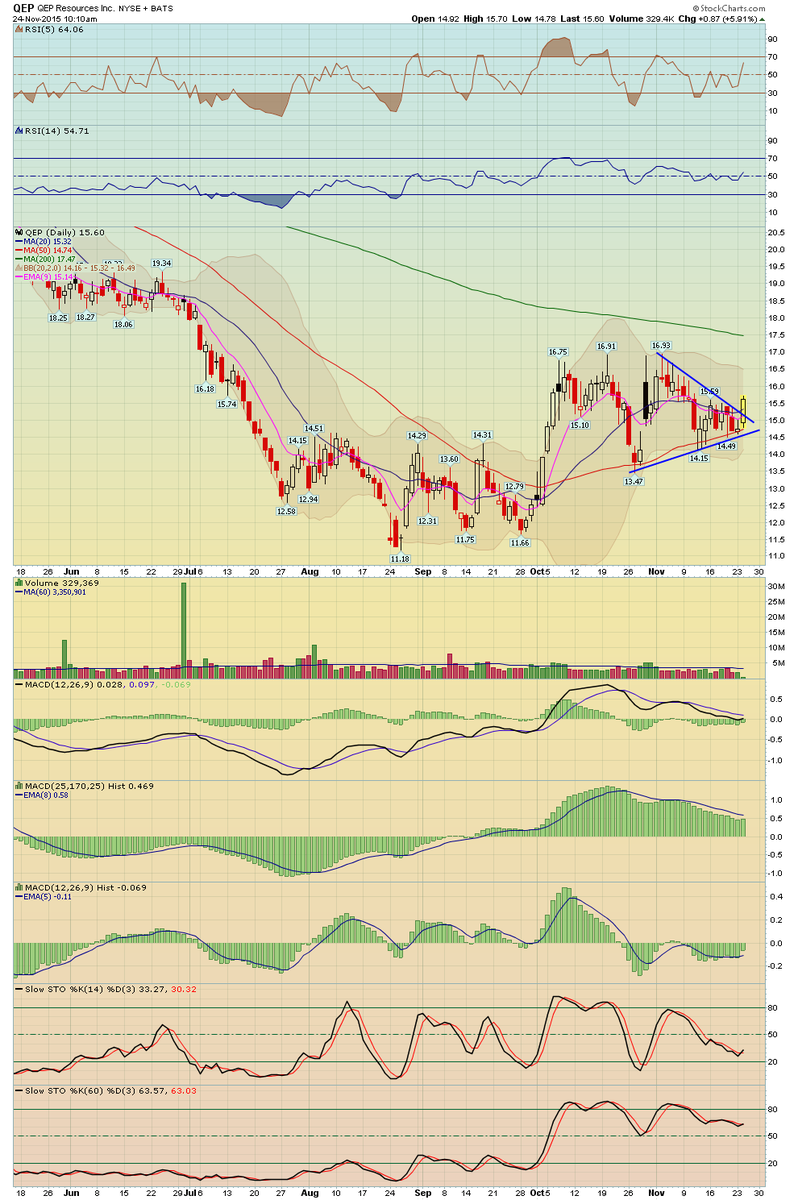
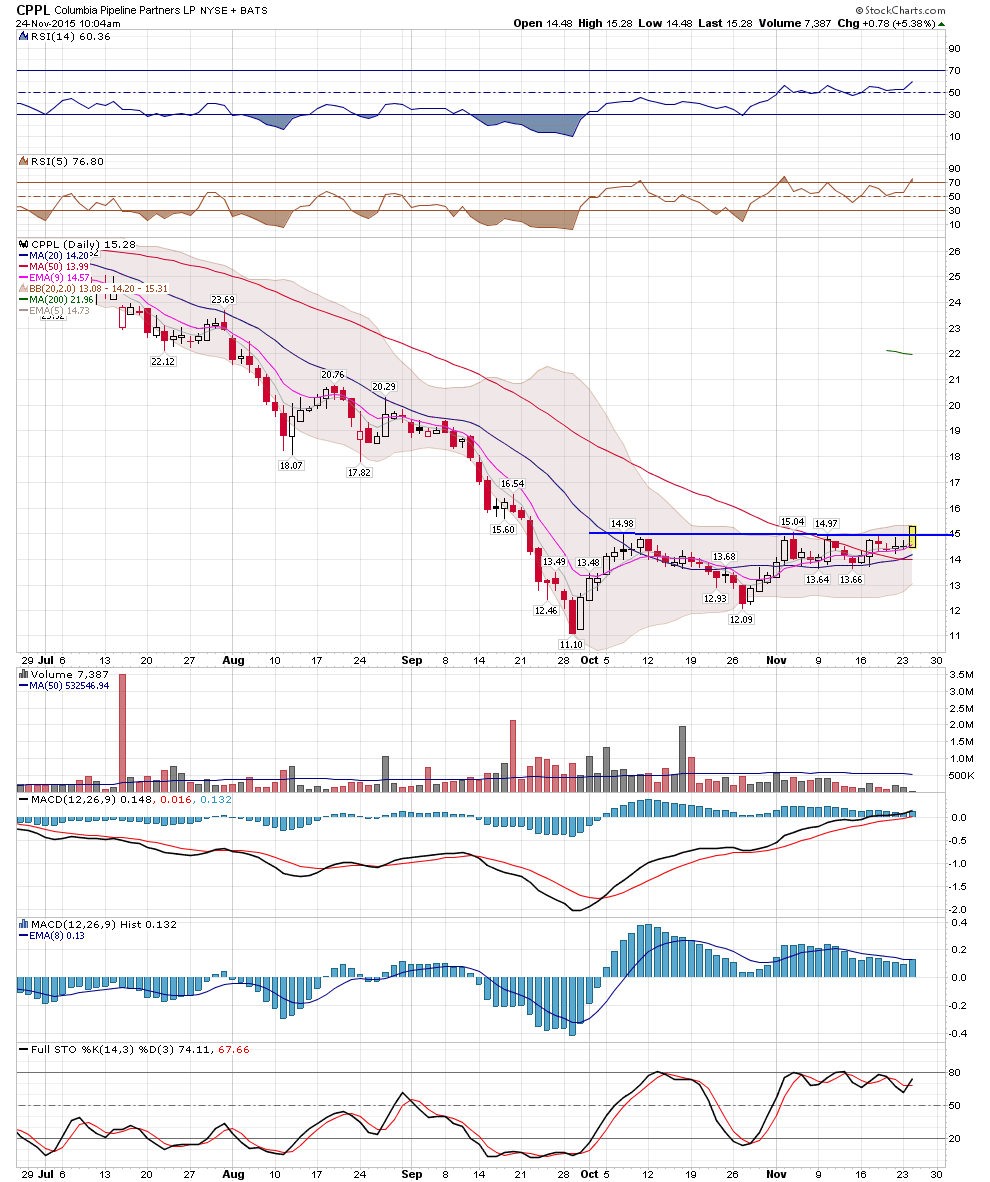
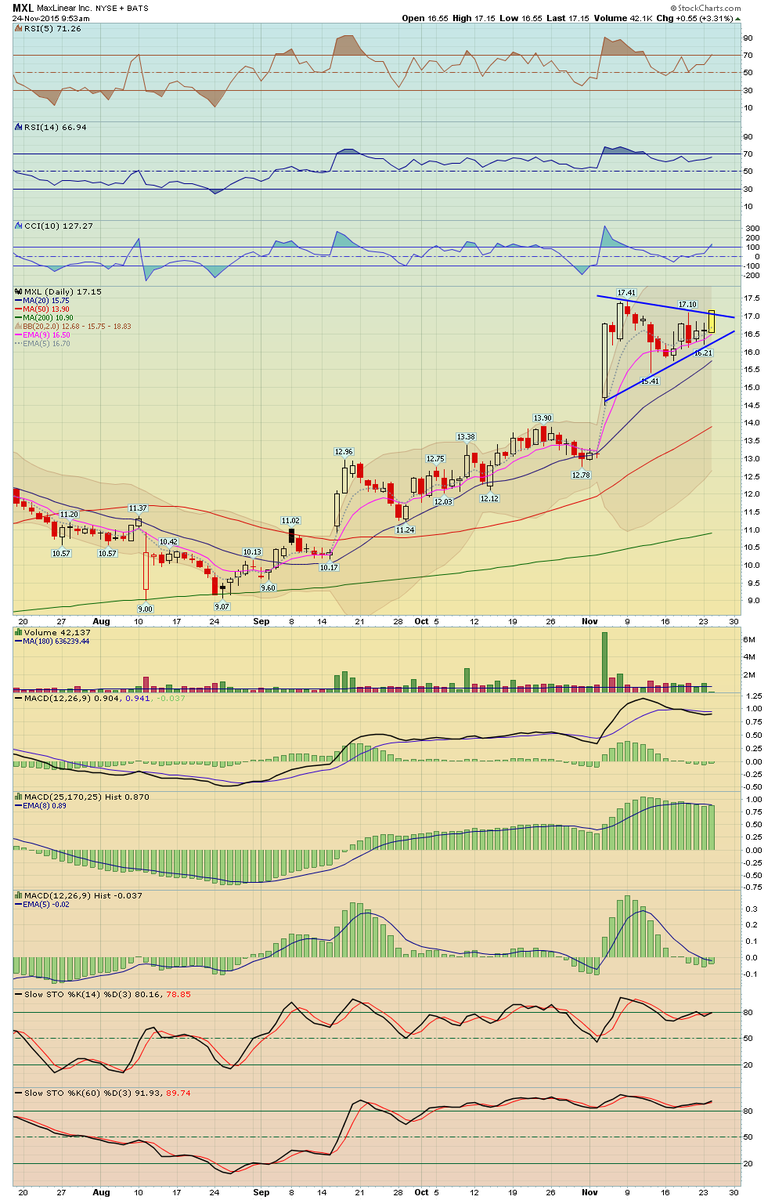
November 29, 2015 Weekend Commodity Newsletter- Free

Here's my comprehensive Commodities Newsletter, best viewed on a desktop computer  


PXD long idea in the energy sector, resistance 150 or buy support with tight stop


EMES, in the energy sector, which is leading today


Here's a snapshot of market sectors, Energy and Precious Metals leading today so far


AMBA long idea, basing or sort of inverse H&S pattern


ESPR long idea, basing pattern


Here's a few Bank Stocks that stand out should the sector breakout, PNC, HBAN, PRU, IVZ


KBE Bank Sector ETF 60 min view, could be small ascending triangle resistance 36.44


VIX Volatility Index 60 min view, short term this potential falling wedge concerns me


SPX 15 min view, in order for the Inv H&S to play out price has to get moving higher right away otherwise negated


SPX 60 min and 30 min views


Longer term I'm still not in love with the Monthly Index charts however, that MACD is really lagging


TICK and Advance/Decline % indicators made new highs whereas the SPX has not yet, perhaps a bullish sign?


GDX Mechanical system is still short from Oct 29th


GOLD weekly views, finally nearing some long term support levels


PXD long idea in the energy sector, resistance is 150.0


Crude Oil Monthly View, best to listen to my discussion from my newsletter which I will post shortly


Crude Oil Weekly views, could be forming a large falling wedge however it needs a new low first to complete wave E


CRB Commodities Index monthly view, wow back to 2001 and 1999 lows


US Dollar charts weekly and daily view


Tuesday, November 24, 2015

DO long idea, had this one on the list for a while as a long off the 20 MA, coming up to a resistance trendline


BCEI follow up, broke out over the trendline, again energy stocks doing well


QEP updated chart, VERY nice breakout on this one


DVN long idea, energy stock, monitoring down trendline


BTE long idea, been on the watchlist for a while, energy stock continues to base out


SPX updated view, I added some additional annotations to the chart, clearly that area is a support band


SPX updated view, I added some additional annotations to the chart, clearly that area is a support band


SPX 15 and 30 min views, there is a support zone at the 2068 ish area and the 38% Fib


ARW short idea updated chart, posted yesterday morning broke down, following through today, trim and trial


QEP trade idea in energy sector posted it yesterday, breaking out today


GOOGL short idea from last night's newsletter, my trigger was the doji inside the wedge


CPPL long idea updated view, broke out over the base was in last night's newsletter and posted this morning


MXL long idea from the newsletter, trying to break out of the triangle pattern


PSX long idea in the energy sector, bounced off the 20 day MA, trendline/triangle


CPPL energy stock, nice base and support at the MA's, resistance around 15 ish


BCEI long idea, oil stocks, sector doing well today