Thursday, October 31, 2013

SPY Pro system update

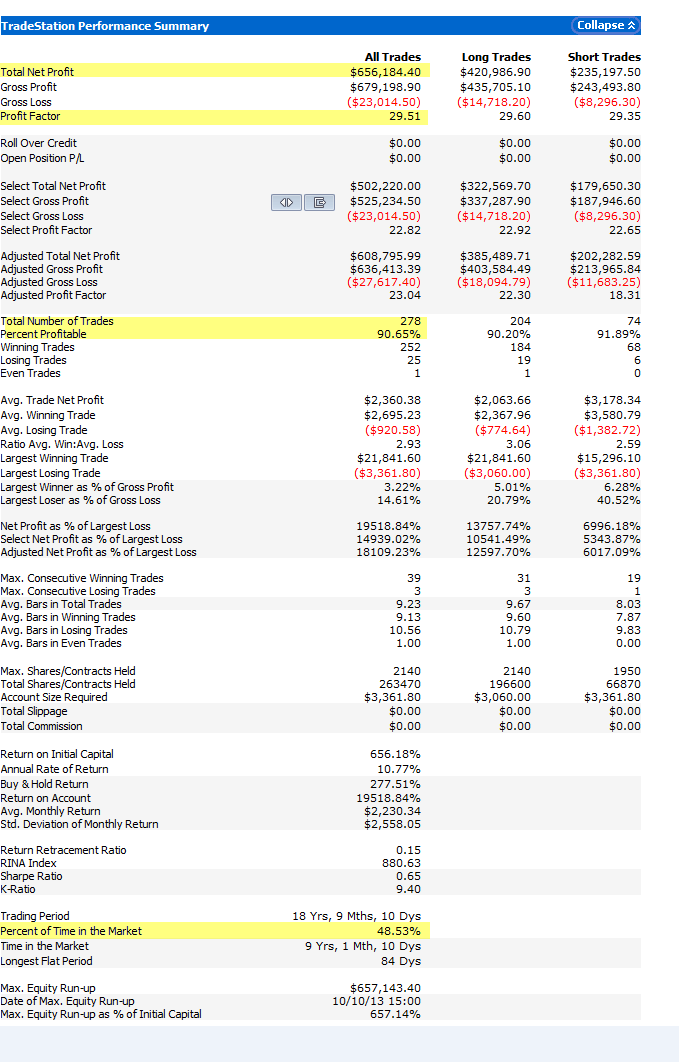
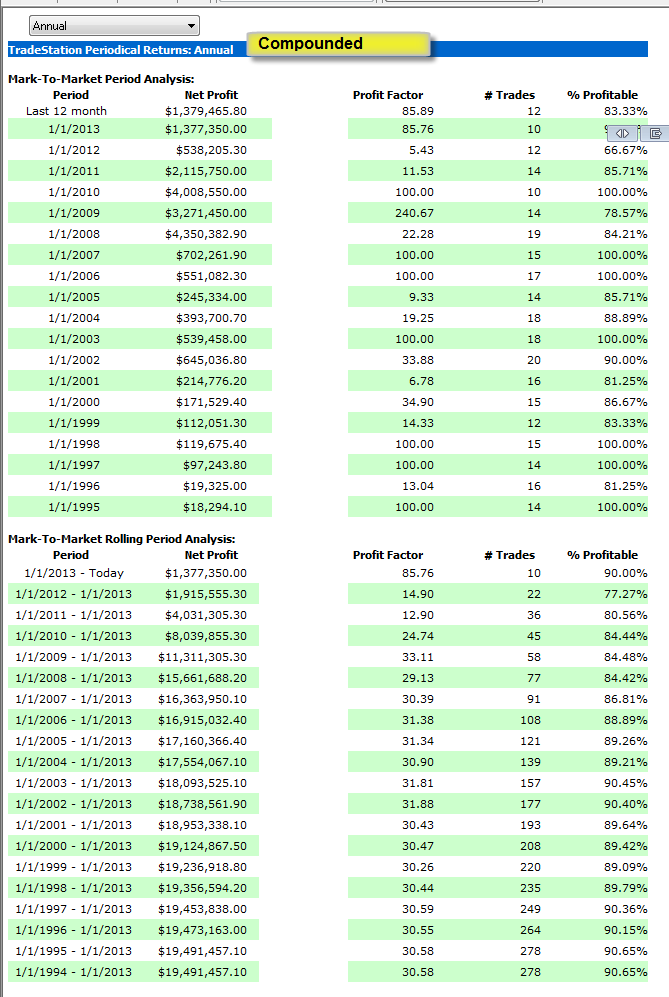
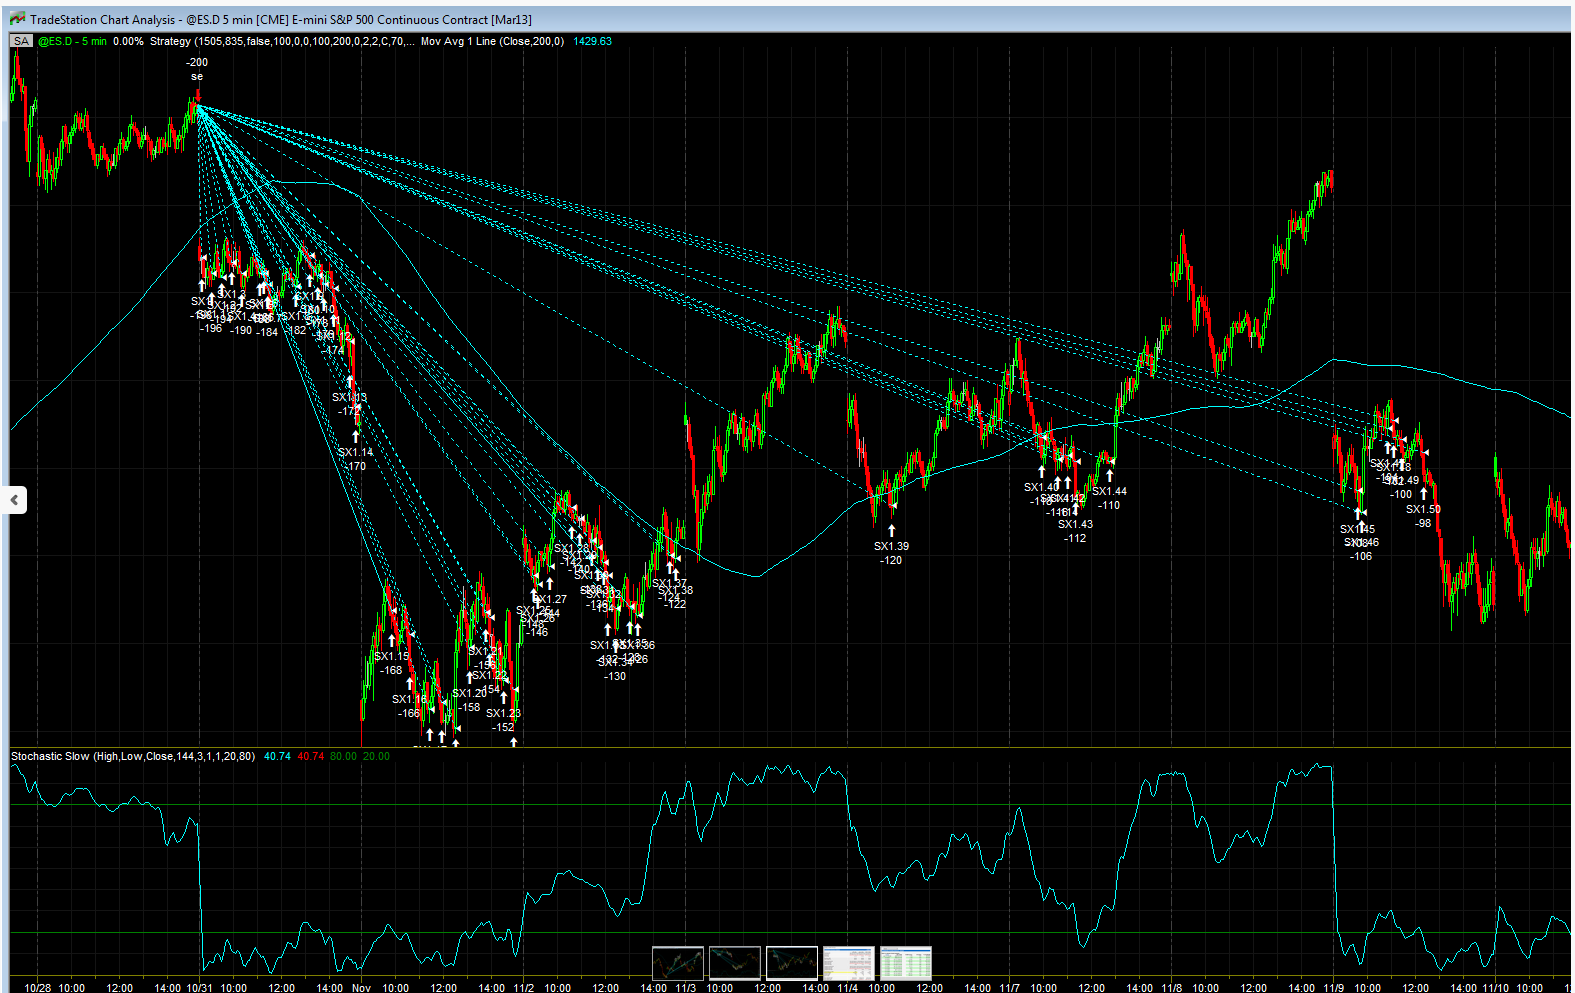
Here's a quick update on the SPY Pro additions, I will do a detailed update when I'm finished, I still have a few things to add, however here's a quick update.  The images below show the original system stats and the new system stats, as well as the old yearly vs new yearly gains - the total has went up quite a bit from 615 -656K.  The number of trades increased some and the percent of time in the market went up from 46.7% to 48.5% which shows the effect of some of the trades that now hold longer. Some of the additional changes that I'm going to make should increase this a little more because it will allow some long trades to hold for longer periods of time; the current work has been on the short side, now I have to work on the long side.


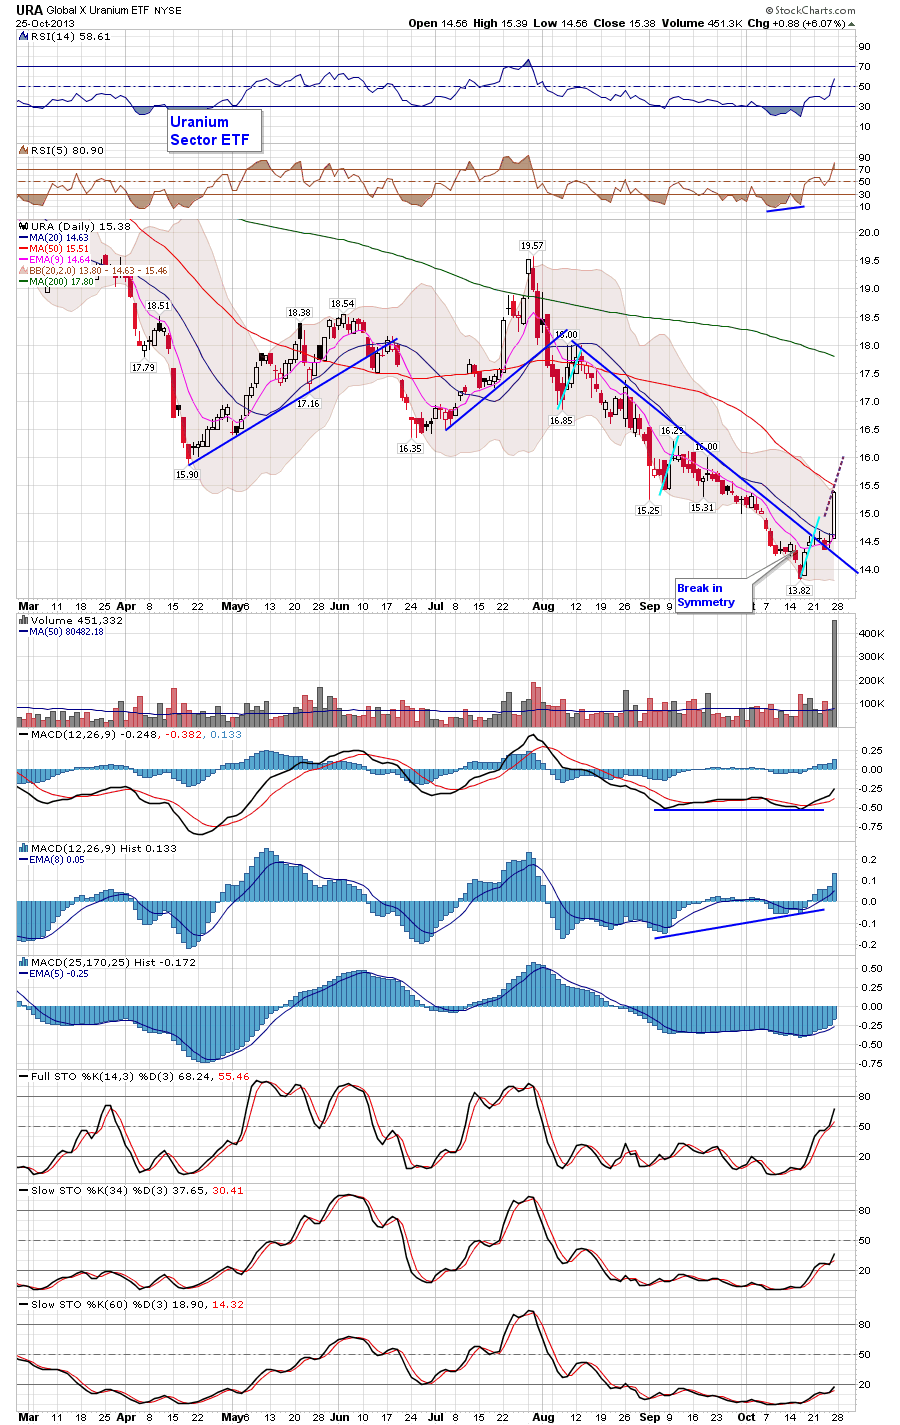
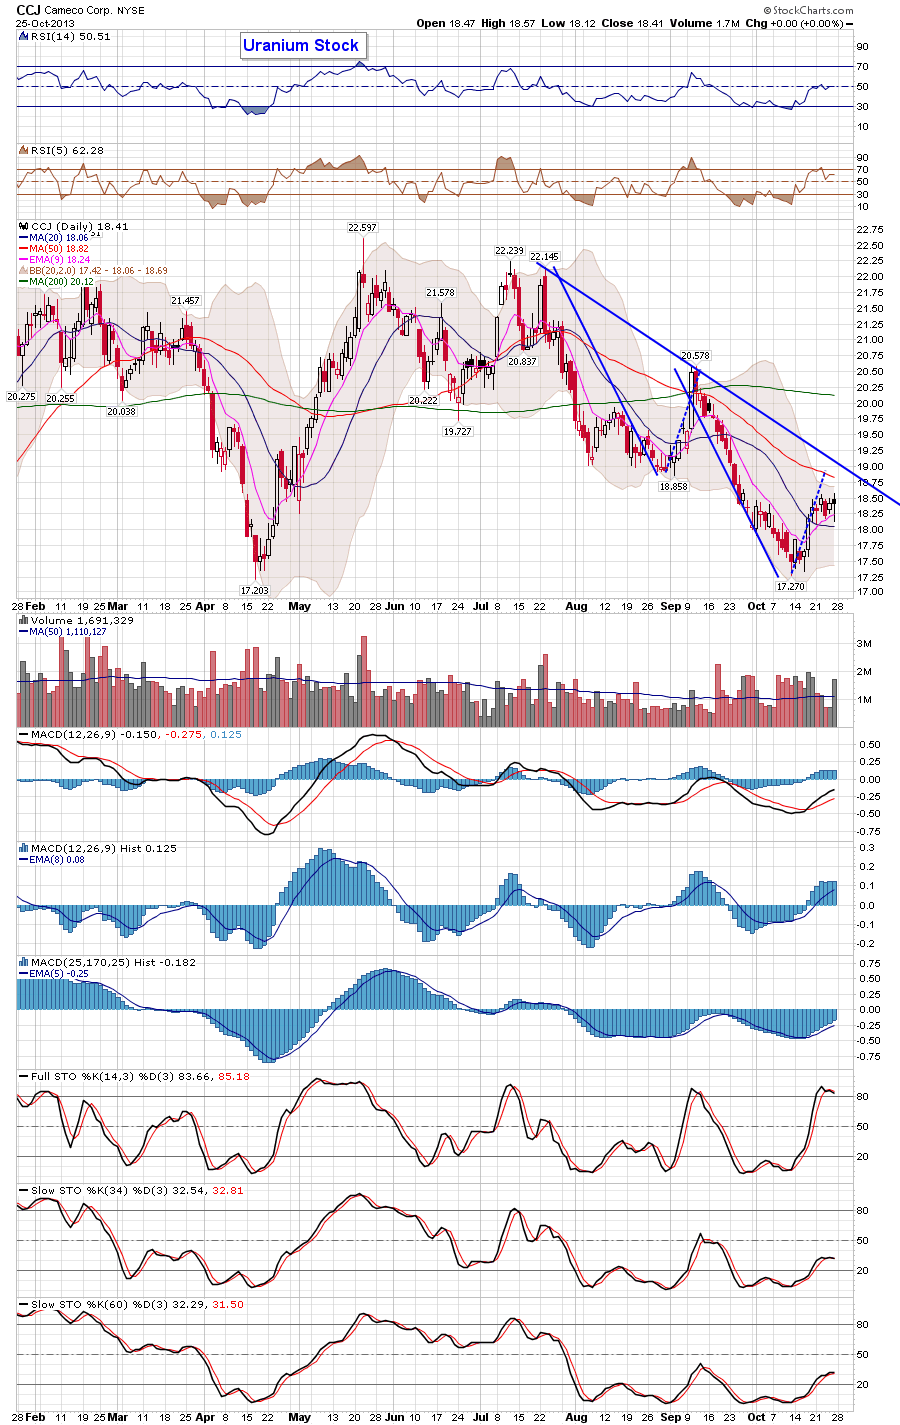
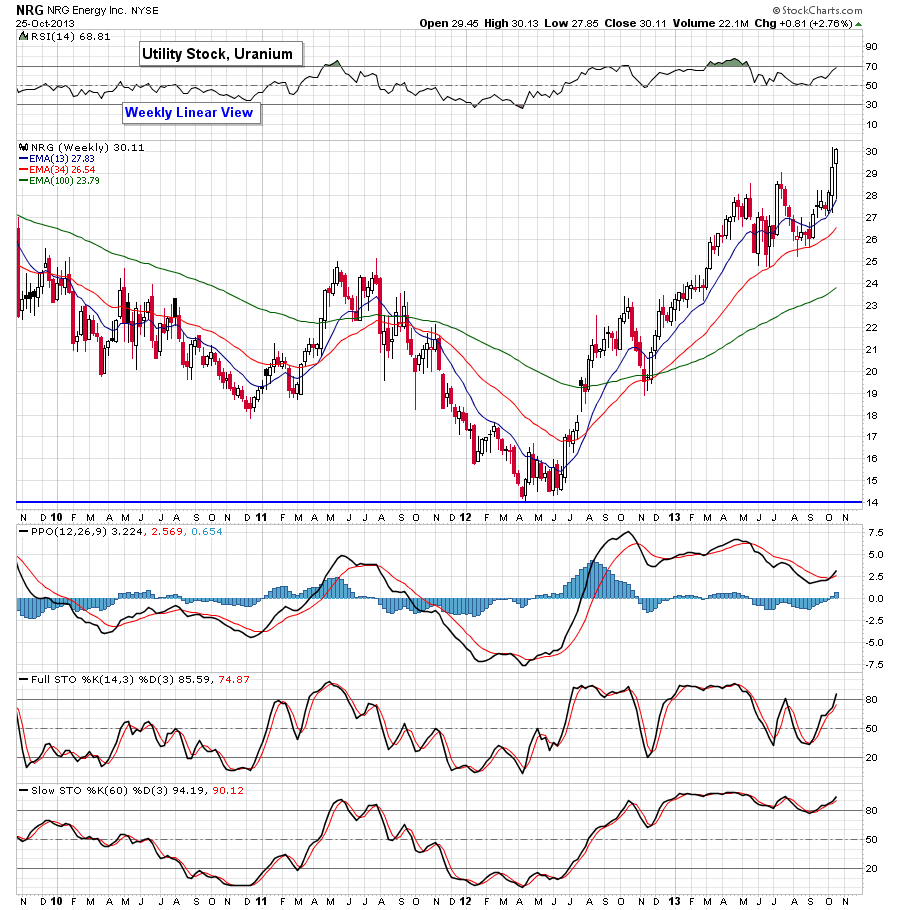
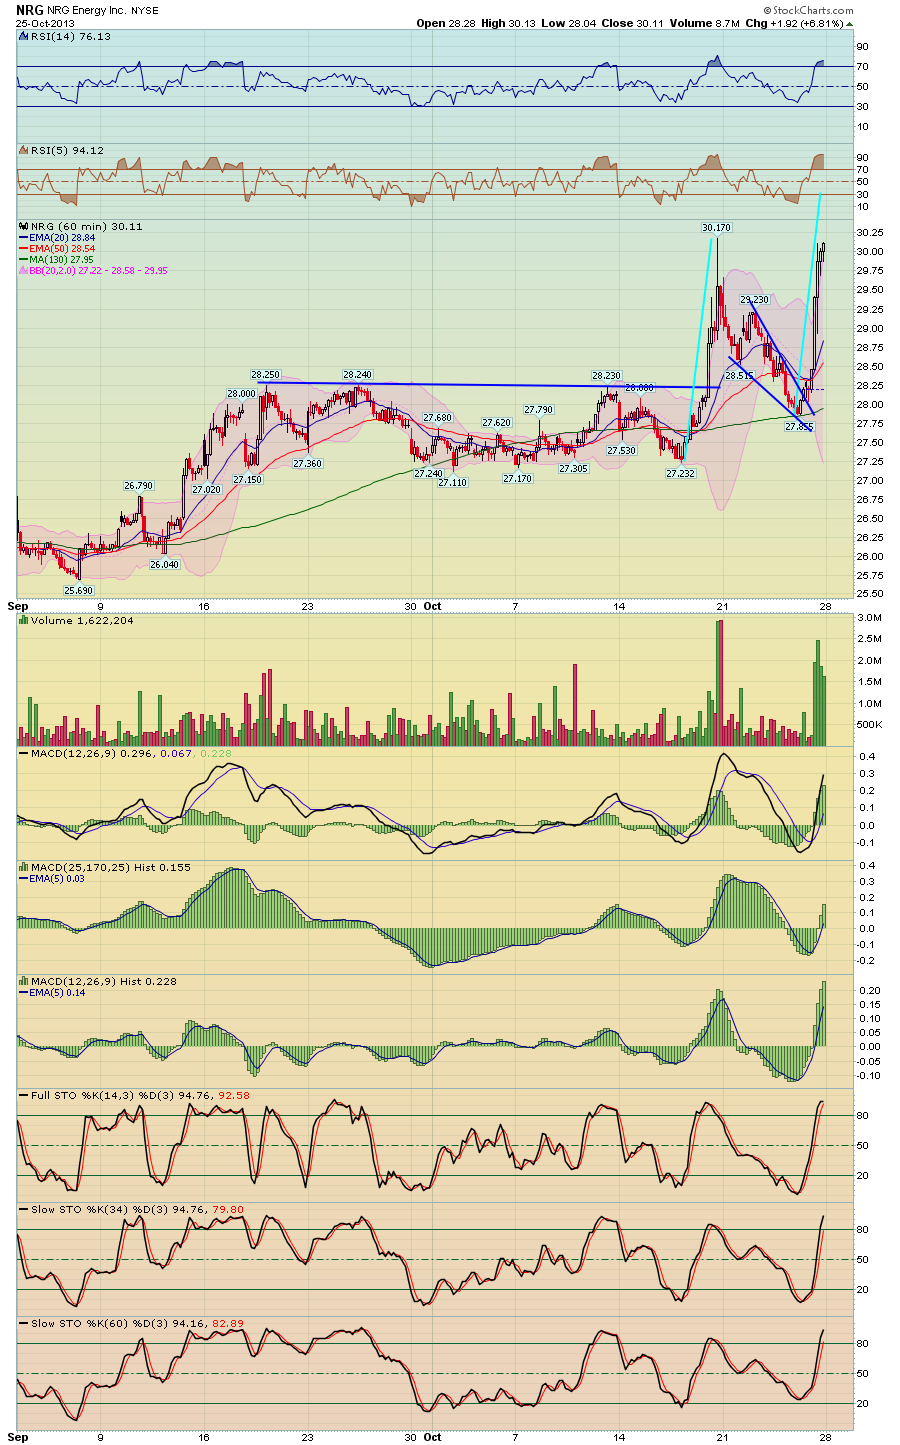
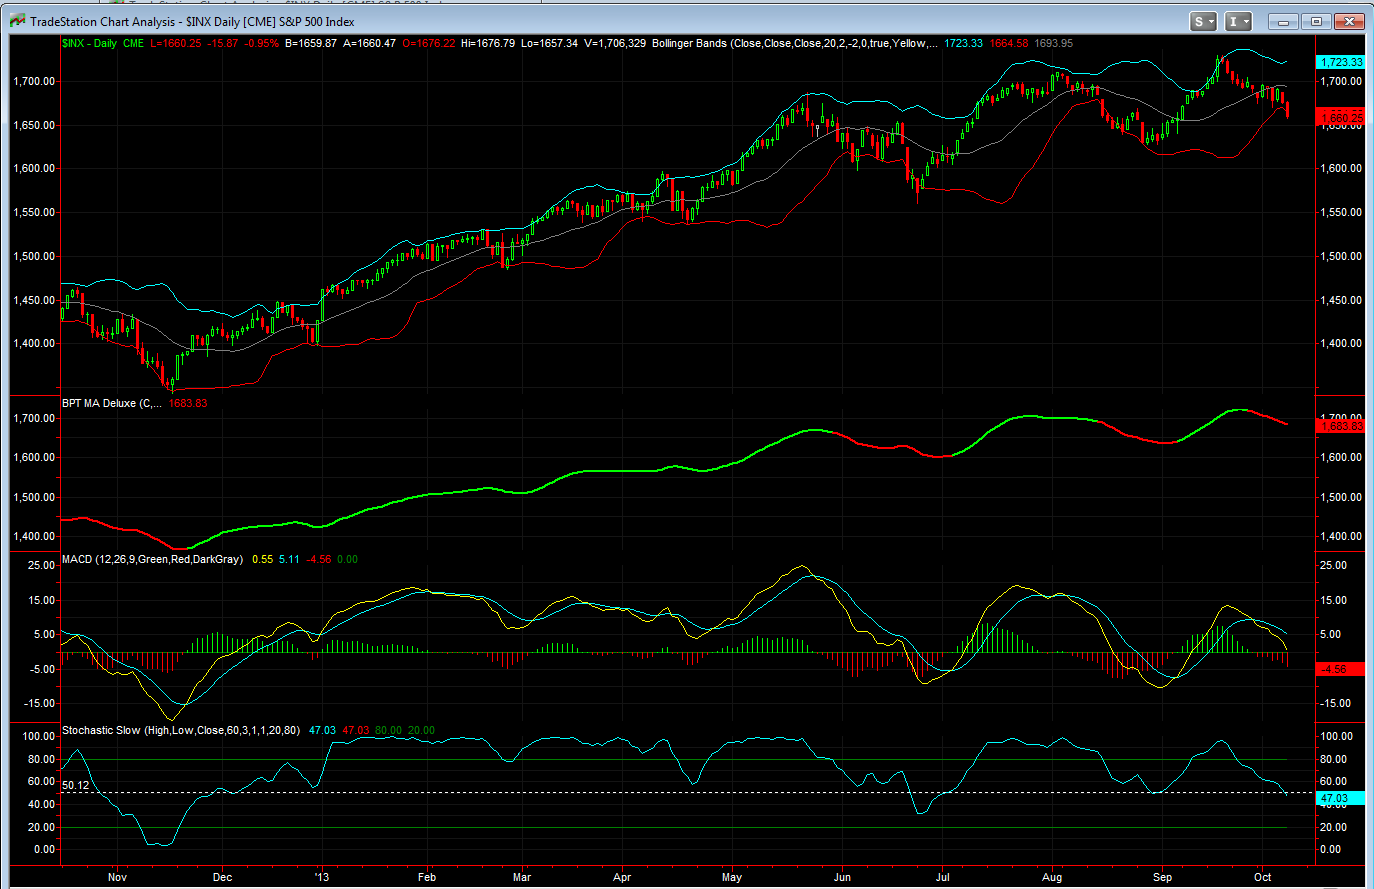
The rules I added were very simple, one of them focuses on the 60 length stochastic and taking low risk trades when it is very close to 50% or 80%, and you know that I use this Stochastic quite a bit in my analysis and trading, none of this was derived through back testing, because I don't need to back test, I just use the concepts that I already use

Sunday, October 27, 2013

Monthly charts and Bollinger Band observations

$INDU - Chart Link - One thing that I've noticed is that the indexes (except for the Dow) have closed well outside of their monthly Bollinger Bands, especially the Nasdaq.


$INDU - Chart Link - this second chart shows a larger version time frame, notice that most of the time, the next month is a down month after closing well outside the monthly BB, not always, but most of the time, 2006 time frame as a notable exception, of course I'm just showing the obvious, things are clearly extended

Uranium Stocks

Some of you have posted how the Uranium stocks have started to move, I cover this in the weekend newsletter, here's some of those charts.  Some of them look interested, however as a side note, generally this is the last 'crap' or sector to rally before the market has a correction - so could be another sign that things are toppy.  Note that I added a lot of symmetry projections, this technique is shown in the tutorial.


URA - Chart Link, ETF


U.TO - Chart Link - price back to long base


DNN - Chart Link - price back to long base support


DNN - Chart Link


CCJ - Chart Link - one of the large caps


CCJ - Chart Link - 60 min view


URRE - Chart Link - back to long term base


URRE - Chart Link


PDN.TO - Chart Link


NRG - Chart Link


NRG - Chart Link

Wednesday, October 23, 2013

Our most recent newsletter

Hello everyone, sorry for the lack of posts lately, I was in China for two week and recently just got back.  Anyway here's our most recent newsletter, also please note that I discuss some recent improvements that I've made to the SPY Professional System.


CLICK HERE to view the newsletter

Tuesday, October 22, 2013

SPY Pro that trades a 5 min ES chart

A fun side note to the BPT Pro system.  I have a professional version that trades ES, it has 99.6% winning trades, with 3592 trades and 629 consecutive winning trades -  however it's really not a system for most of us here because it is designed to trade large numbers of ES contracts - 50 to 600 ES contracts or more, which is a little rich for my blood and probably for most of you - the lowest # I would trade the system with would be probably 30 - 40 ES contracts, though it does better with more because what the systems does is that it takes the daily trade signals, then uses a 5 min chart to scale in an out at extreme levels intra day and overnight, and the more contracts it trades, the better it can do this.


anyway I suppose if there are any hedgefunds here or Pros, you can contact me if you are interested. Otherwise most of us won't be trading this obviously because of the capital needed, but it's kind of neat to look at the trades and it's a slow day so posting it for fun.  Though maybe one day I could set this up on my IB account and some of you accredited investors could link to my account for a fund of some sort, who knows

Tuesday, October 8, 2013

BPT MA Deluxe

good so far!  

Thursday, October 3, 2013

Webinar on BPT MA Deluxe Indicator

Here's the recording for the BPT MA Deluxe Indicator that I did today. We've uploaded it to YouTube so that anyone can watch it - however please note: You must select either HD or 1440 HD because by default Youtube plays at 360i and that is too low a resolution to read anything, also please expand YouTube to your full screen size because that's how the video was recorded.

You Tube Video

Webinar Today and our most recent Newsletter

Hello everyone, I haven't posted on our free blog in a while, however here's a link to our most recent newsletter - also note, today we have a webinar where I discuss our BPT MA Deluxe indicator, which has been pretty awesome at catching market trends

CLICK HERE to view the Newsletter - a link to the webinar is provided in the first segment of the newsletter.

The webinar begins at 5:00 pm EST and will last probably 45 min to an hr.  I also plan to record it for those who can't make it.

Matthew Frailey