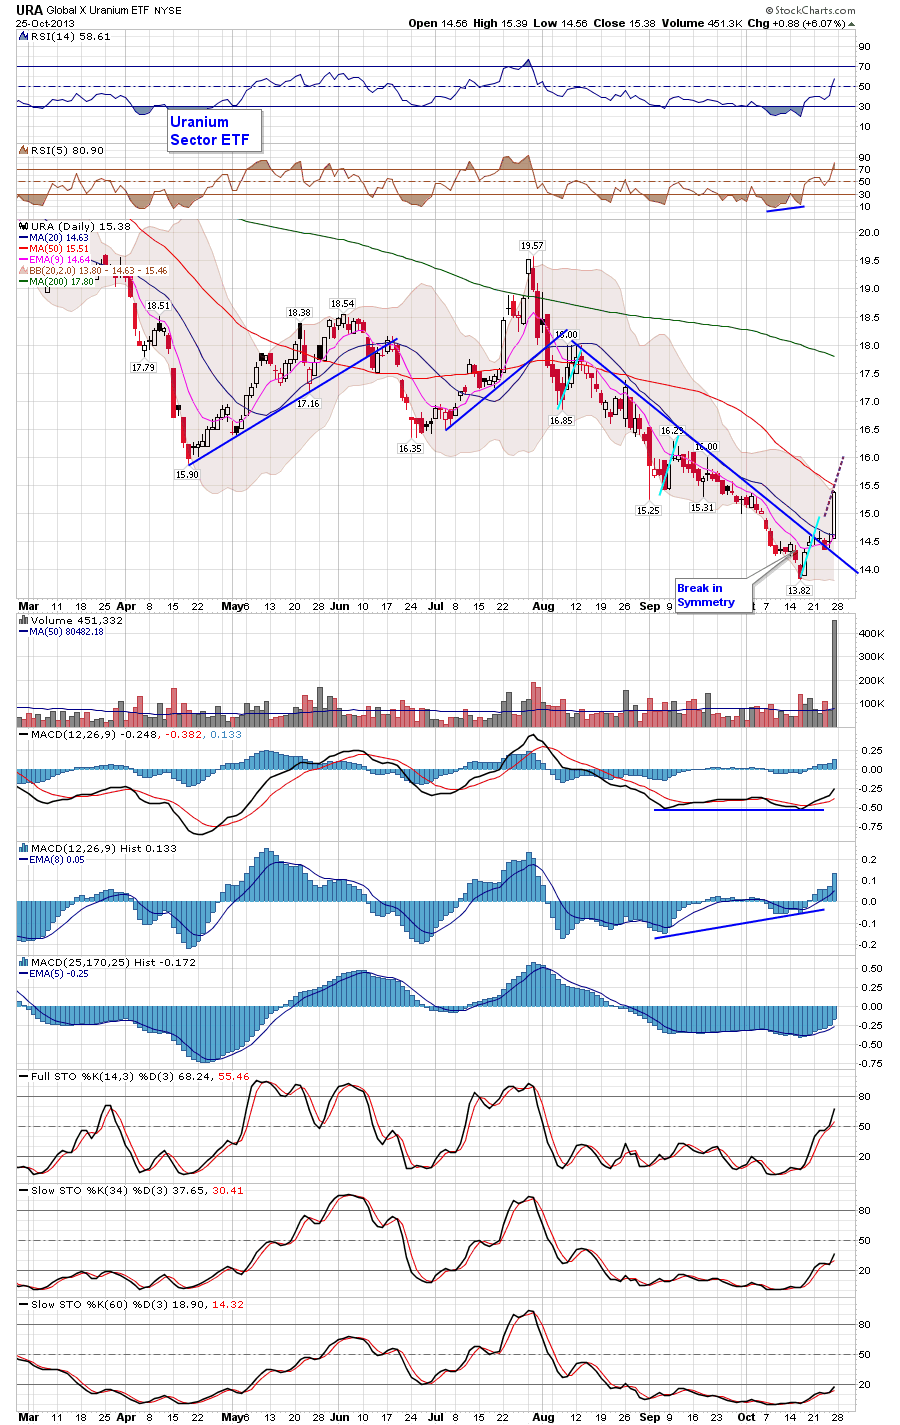
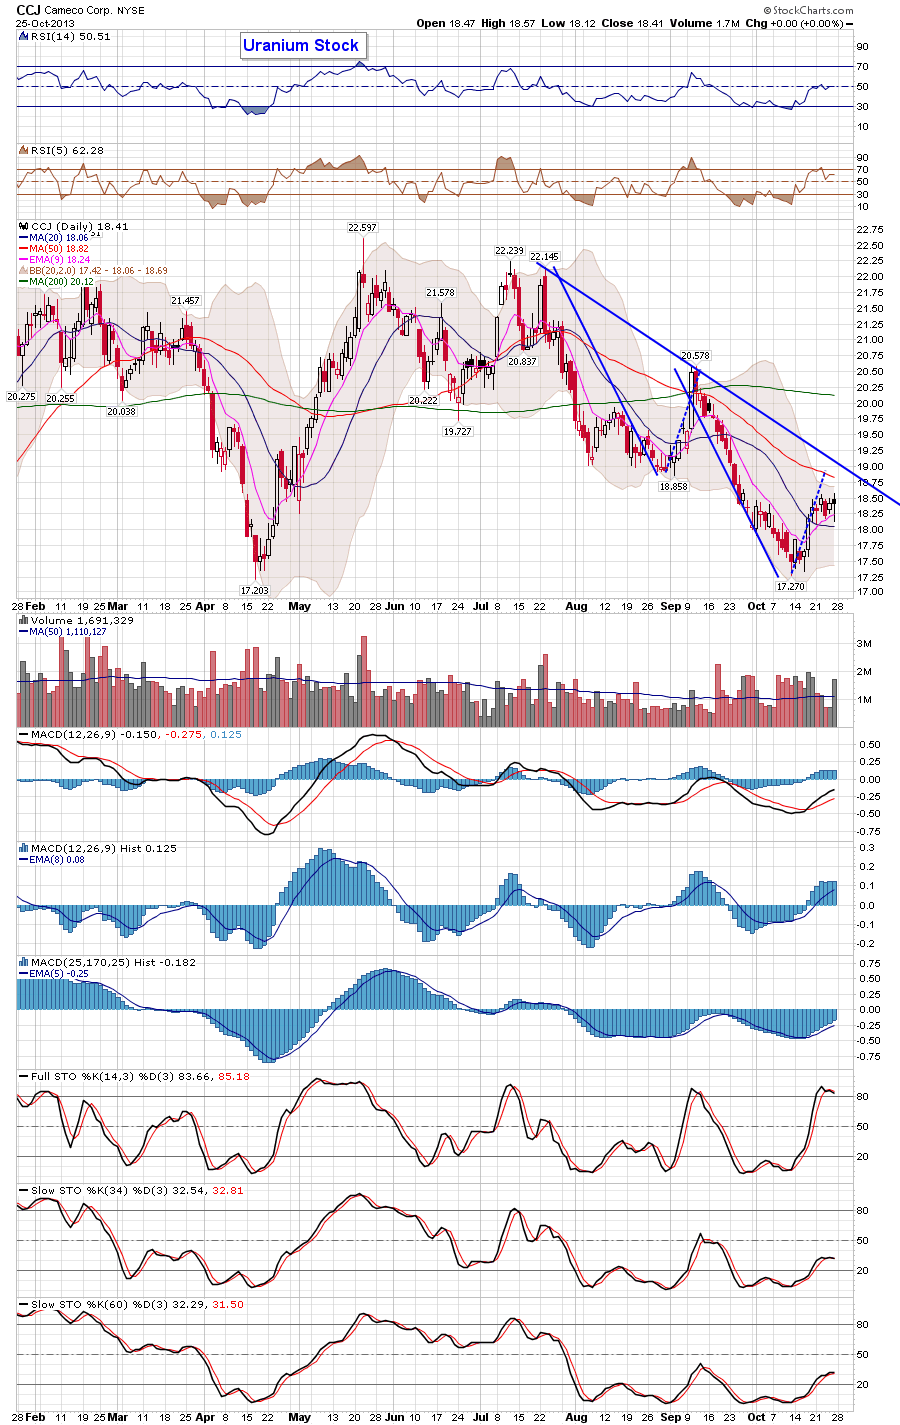
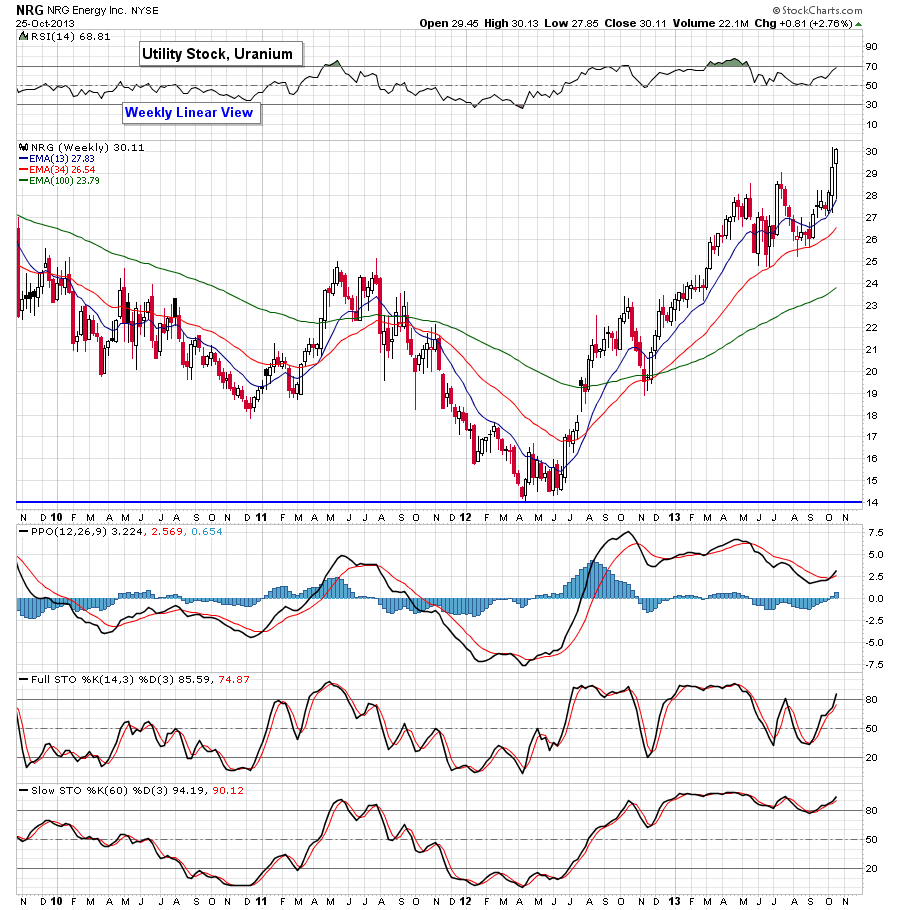
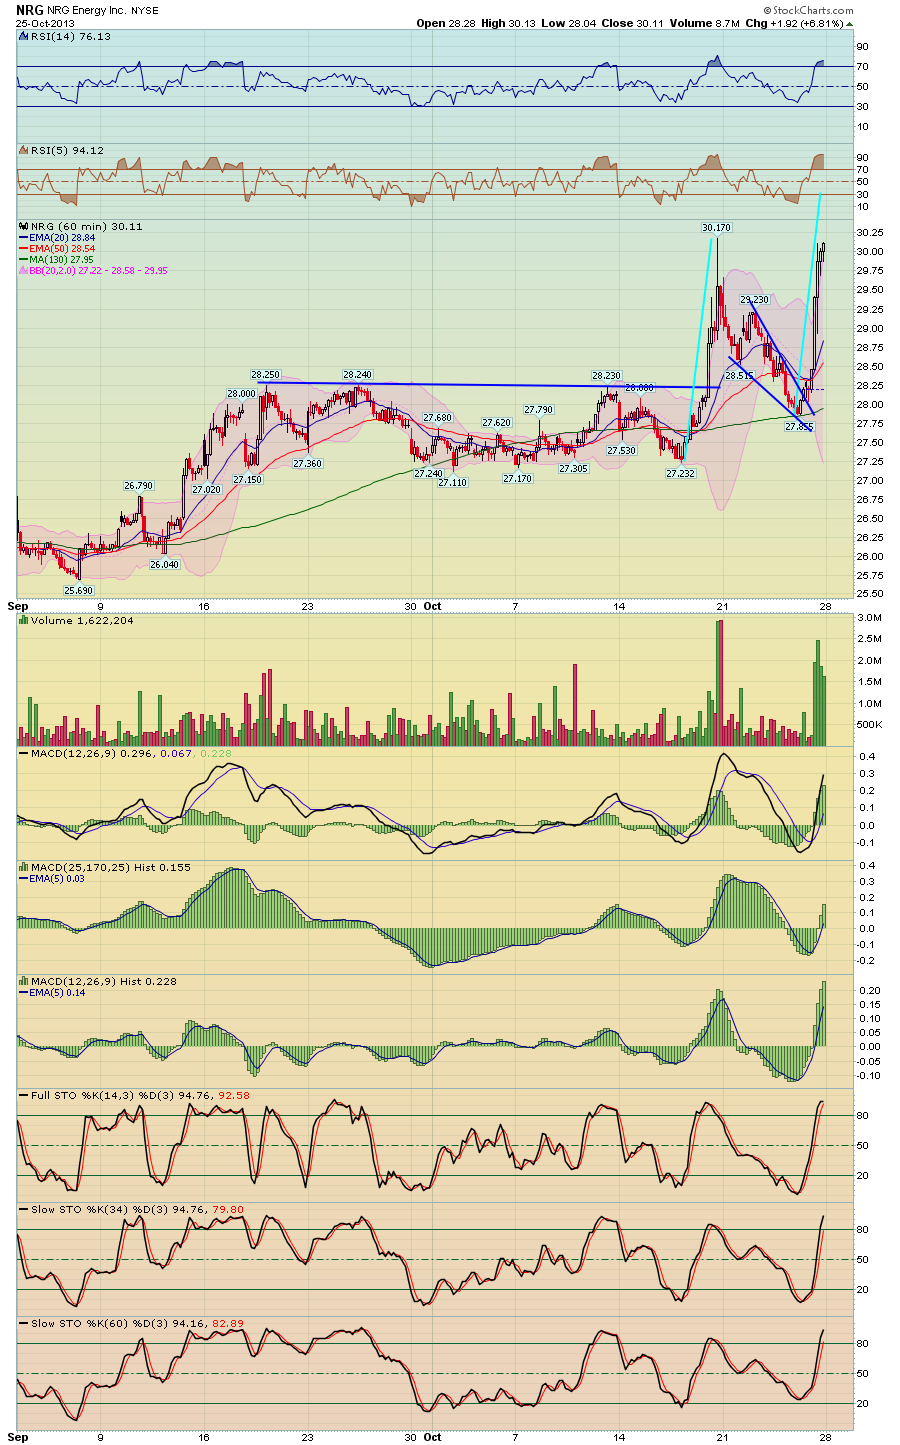
Some of you have posted how the Uranium stocks have started to move, I cover this in the weekend newsletter, here's some of those charts. Some of them look interested, however as a side note, generally this is the last 'crap' or sector to rally before the market has a correction - so could be another sign that things are toppy. Note that I added a lot of symmetry projections, this technique is shown in the tutorial.
URA - Chart Link, ETF
U.TO - Chart Link - price back to long base
DNN - Chart Link - price back to long base support
CCJ - Chart Link - one of the large caps
CCJ - Chart Link - 60 min view
URRE - Chart Link - back to long term base


No comments:
Post a Comment