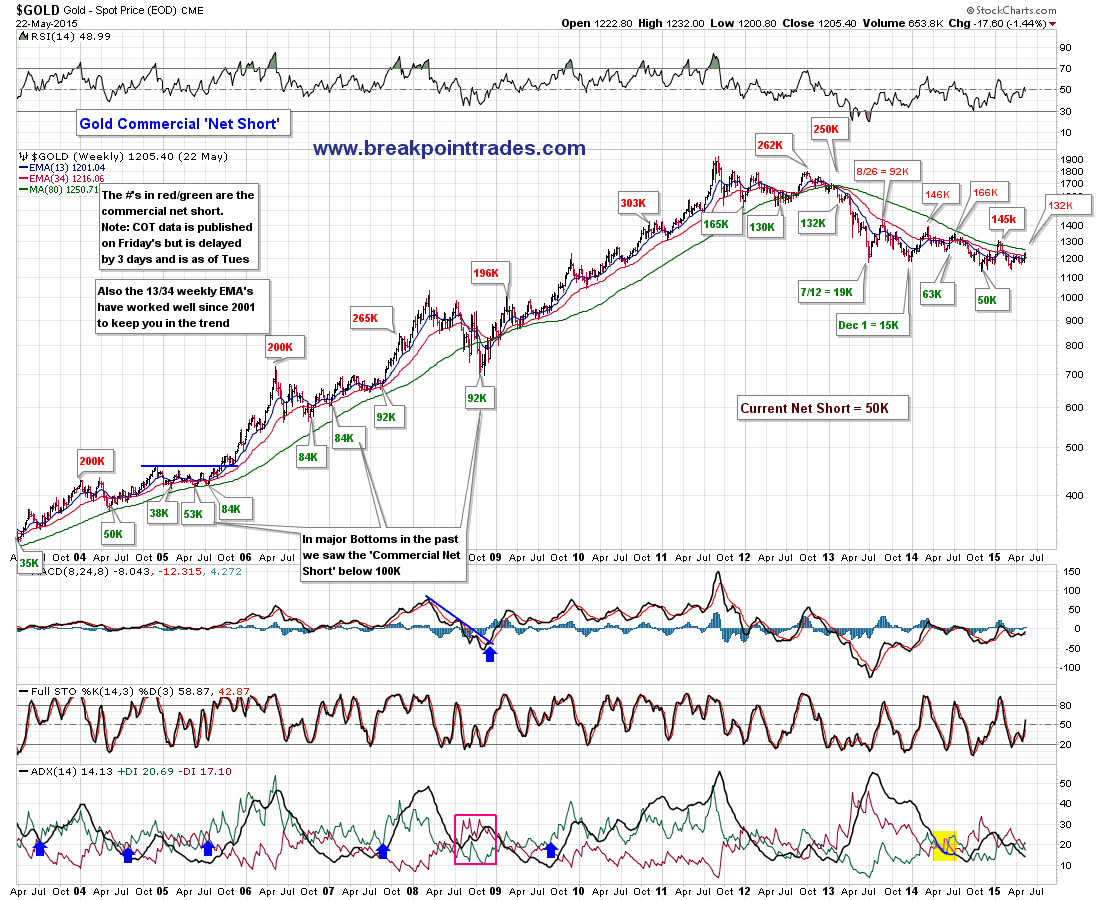
Last week shows the commercials were net short 132K. Here's my history chart, now I have not updated this in a couple months, however lately you can see that it's been topping out in in the lower to mid 100K range.
Tuesday, May 26, 2015
Gold Commercial Net Short
Last week shows the commercials were net short 132K. Here's my history chart, now I have not updated this in a couple months, however lately you can see that it's been topping out in in the lower to mid 100K range.

Thursday, May 21, 2015

From a Member- Never-ending SPX / Bond battle at 2007 resist rages on.�Aaron ...
Never-ending SPX / Bond battle at 2007 resist rages on. Aaron ...
Never-ending SPX / Bond battle at 2007 resist rages on.


Transports
Transports
$TRAN - Chart Link - bouncing off support for now
$TRAN - Chart Link - remember the 15 min had divergence
$TRAN - Chart Link - 60 min bouncing off the trendline for now, going forward we'll see....


Tuesday, May 19, 2015
GDX and system comments
GDX and system comments
Nice pullback today in the metals, however not surprising, GDX basically reversed at the 200 day MA and the upper channel, and as you know we kept hinting to watch the GDX/GLD ratio and it had started to trend day late last week.
The BPGDM Renko system off to a good start, the trade is up 3.6% in one day, but again as I alluded to earlier, the average signal lasts over 60 days, a lot can happen in that time, so even if you followed that chart don't be afraid to lock in some profits on your own if you see a reason to via the charts


BPGDM comments
BPGDM comments
The trade triggered yesterday, already up 2.4%. However see the trade stats and history below the chart, notice that the last one was the shortest time at 33 days, the average is 61 days so just put that into perspective, a lot can happen in 30 or 60 days, the trade could be up a lot more or it could be down by the time it closes - if you see a good signal on your normal charts, take some profits

Monday, May 18, 2015
GDX 1 point Renko System
GDX 1 point Renko System
Interestingly I noticed that using a simple 1.00 box size for GDX on a Renko chart has worked well as a simply system since Oct 2013, no losing trades, 80% cumulative gain, non-compounded. However before this date it gets a lot more choppy, which makes sense because I hard set the Renko to a box size of 1 point, so as GDX changes price over time that would need to be adjusted.
I also didn't try to curve fit a Renko size, that's why I simply selected 1.00 vs some odd number.
also - YOU CANNOT use ATR because the past signals change because ATR changes as it's the average of the last 14 days, thus setting it to a hard box size of 1.00 allows all the past signals to be set
Again I'm showing this because it's interesting and may be something to keep an eye on, however Steve and I get our trade signals via normal Technical analysis - but it's still an interesting chart

Friday, May 15, 2015

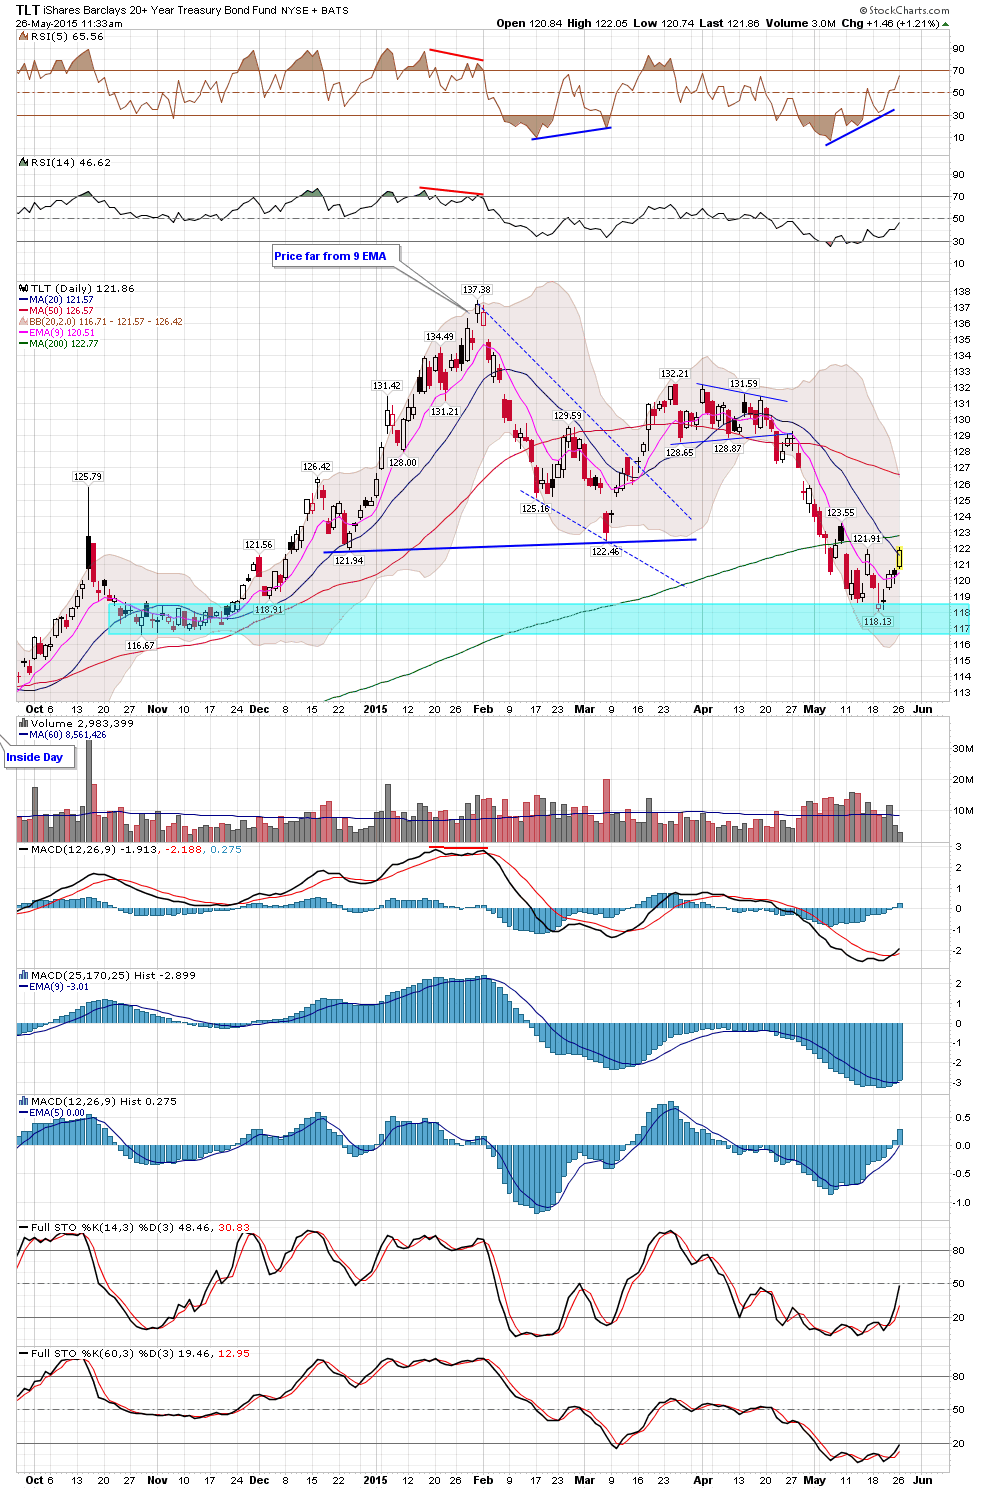
TLT Views
TLT Views
Gapped up after showing an inside day candle yesterday (and falling wedge pattern).
It also had some timing symmetry 5/15-5/18 for possible low.


Thursday, May 14, 2015
GDX - Chart Link�- nice pullback off the highs, inverted ...
GDX - Chart Link - nice pullback off the highs, inverted ...
GDX - Chart Link - nice pullback off the highs, inverted black candle forming near the 200 MA and 61.8 Fib, also near the channel upper trendline, see second chart
GDX - Chart Link - also the new high as I mentioned this morning set up Divergence


Wednesday, May 13, 2015
Wednesday, May 13, 2015 Newsletter- Free
Hello everyone, as you know, it's been a very choppy market this year, here's my free market newsletter with my thoughts - definitely some warning signs out there.
CLICK HERE to view the newsletter.
CLICK HERE to view the newsletter.
also follow up on Twitter
https://twitter.com/breakpointrades/ |
| Breakpoint Trades has been in business for over 12 years now provding the best technical analysis on the market, commodities, and great stock picks. Should you ever need help, have a question, or you would like to talk to Matt or Steve, please send us an email through our contact page |
I added the Tran/Dow ratio to the chart - you ...
I added the Tran/Dow ratio to the chart - you ...
I added the Tran/Dow ratio to the chart - you can really see this with how the ratio is trailing down

Tuesday, May 5, 2015
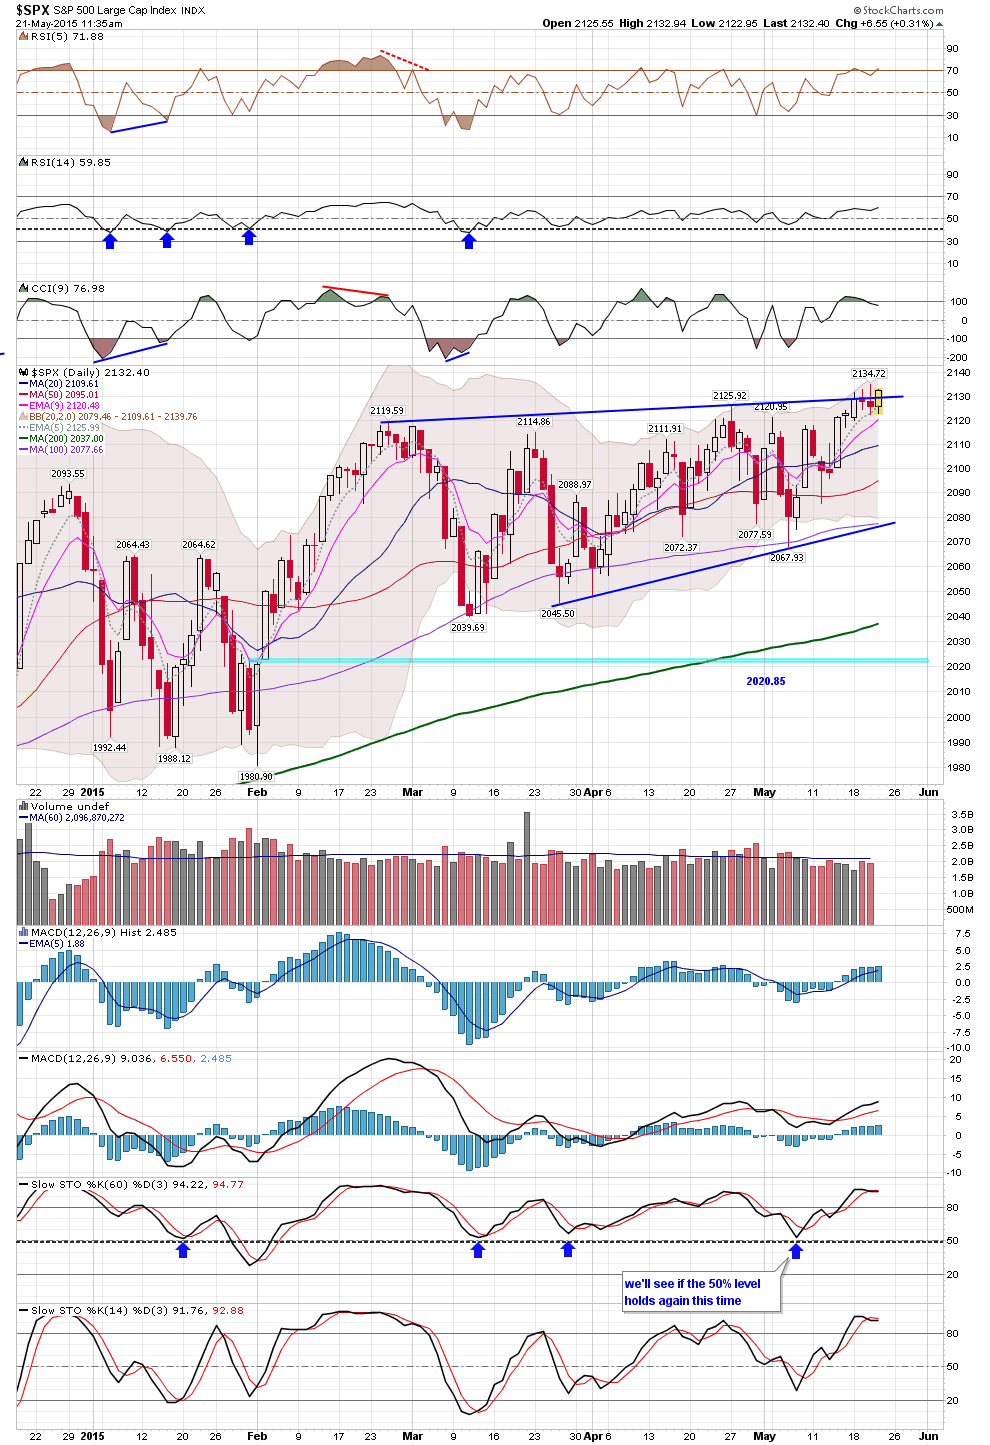
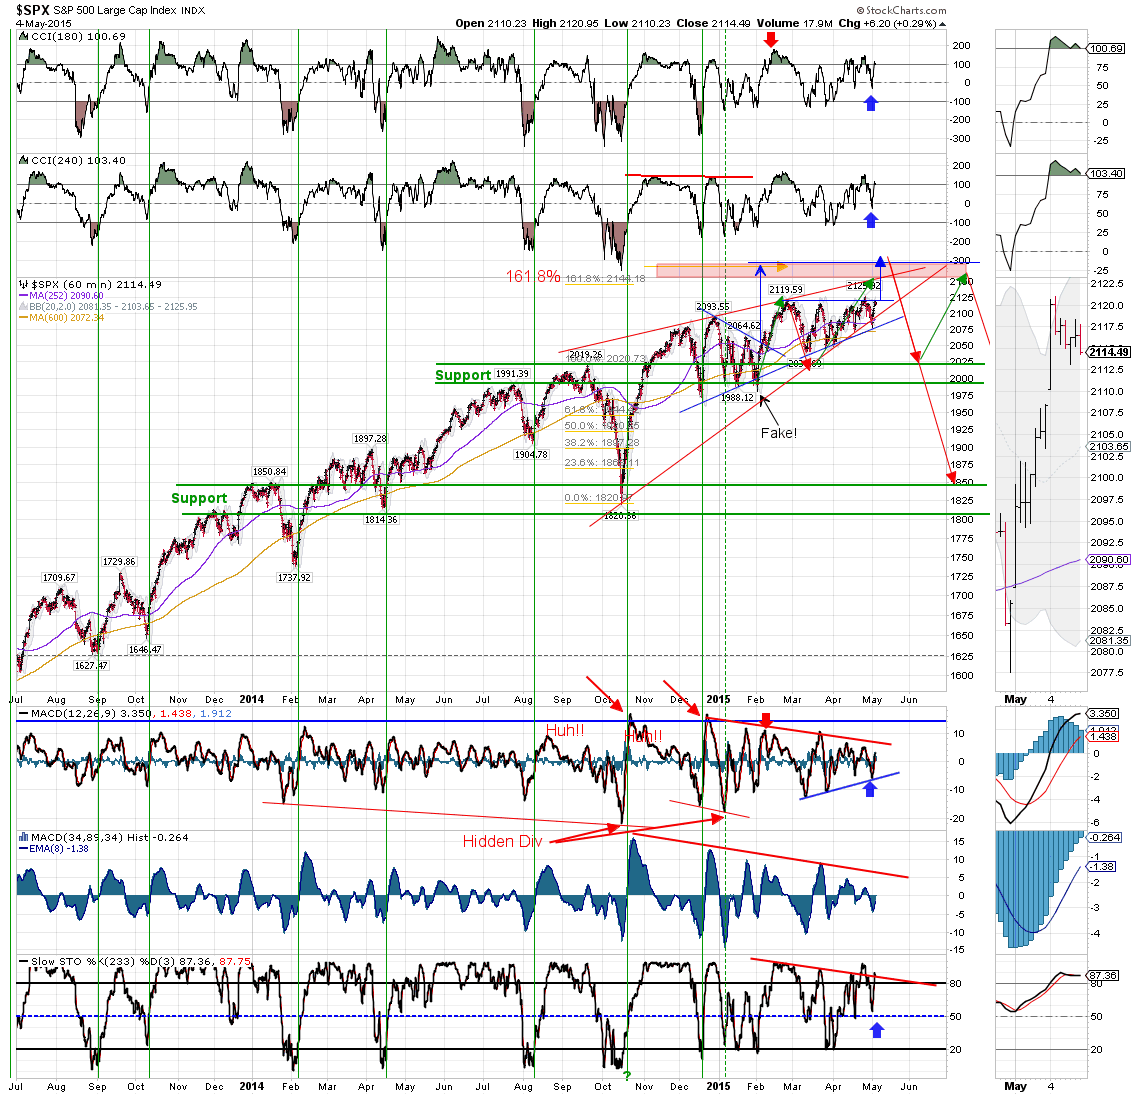
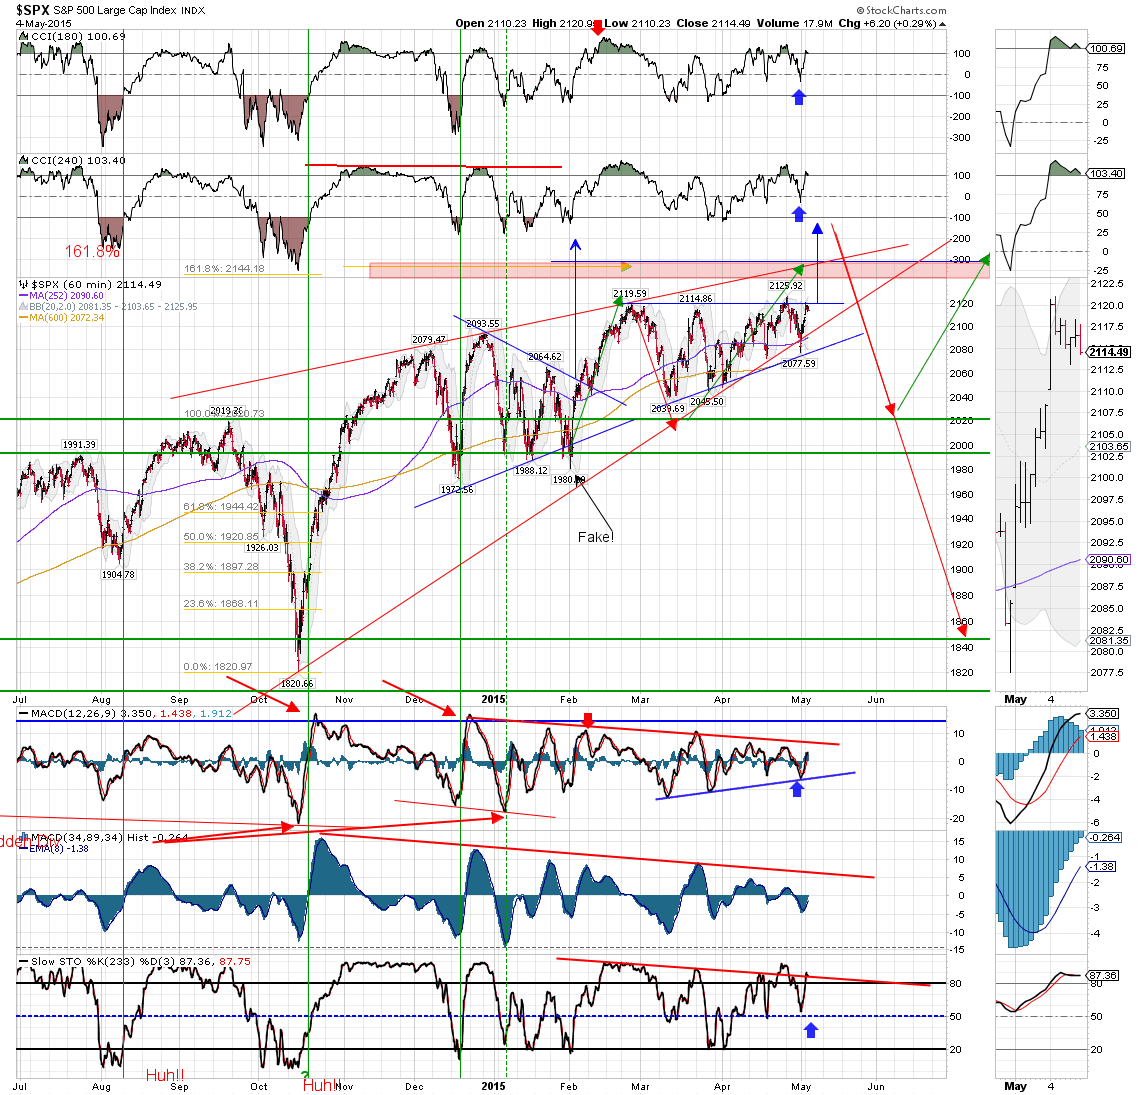
$SPX Daily
SPX Daily
$SPX - Chart Link - still plenty of room to the lower trendline, the 50 MA is first big support.
again this has been the theme this year, choppy ass traders market


Monday, May 4, 2015

Sunday, May 3, 2015
Here's our Comprehensive Market Newsletter
I hope everyone had nice weekend! Here's our highly detailed Market Newsletter where I discuss what we are setting on a short term and long term technical basis on the market
CLICK HERE to view the newsletter
CLICK HERE to view the newsletter
Friday, May 1, 2015
TLT Views
TLT Views
Continues to move lower after breaking down out of a triangle pattern. Price approaching uptrend line from 2014


Subscribe to:
Posts (Atom)