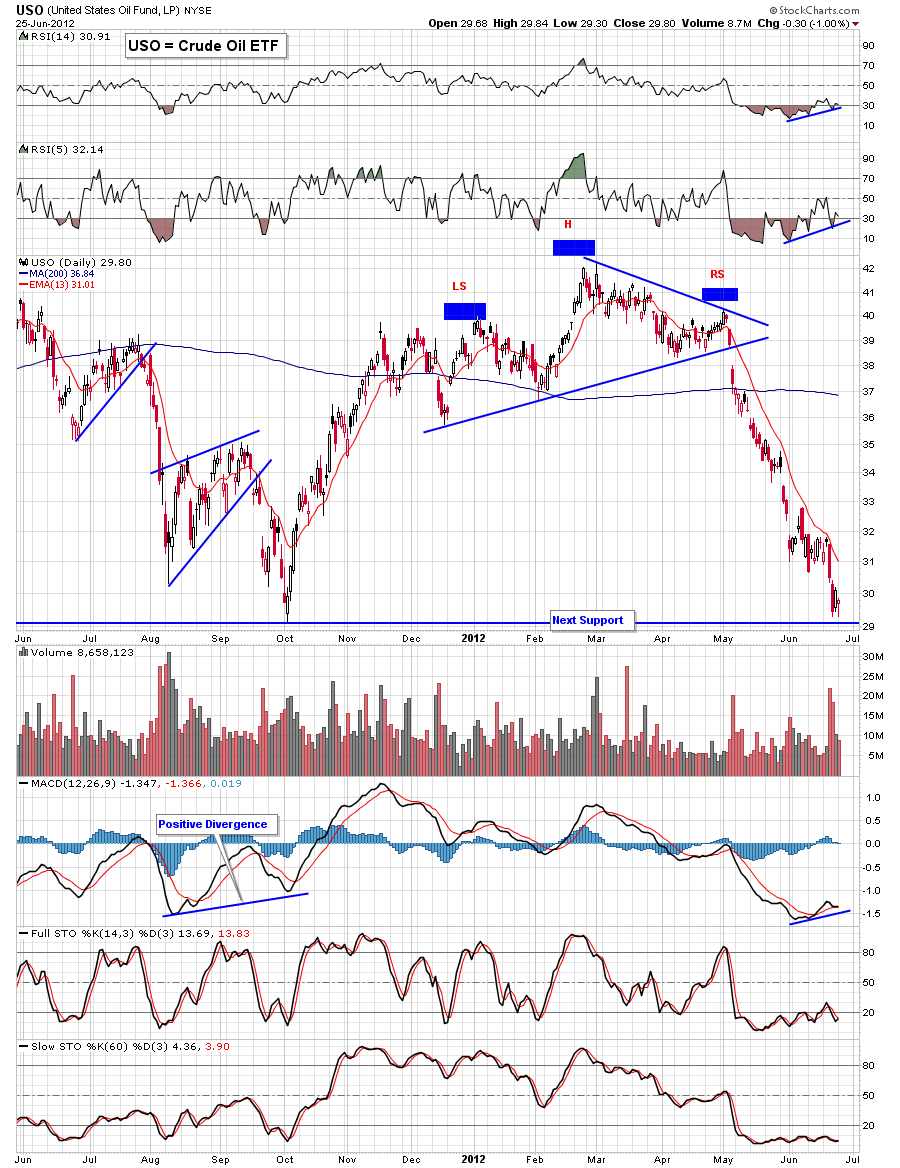
- Here's an updated daily chart of Crude Oil, the Aug/Oct 2011 bottom is closing it and positive divergence is forming via the two RSI indicators at the top of the chart as well as the MACD. Bottoming is a process, I think crude oil is in the beginnings of a bottoming process. Otherwise in the short term the 13 EMA is resistance (green MA)
- The second chart is the ETF USO, the same analysis basically applies.

No comments:
Post a Comment