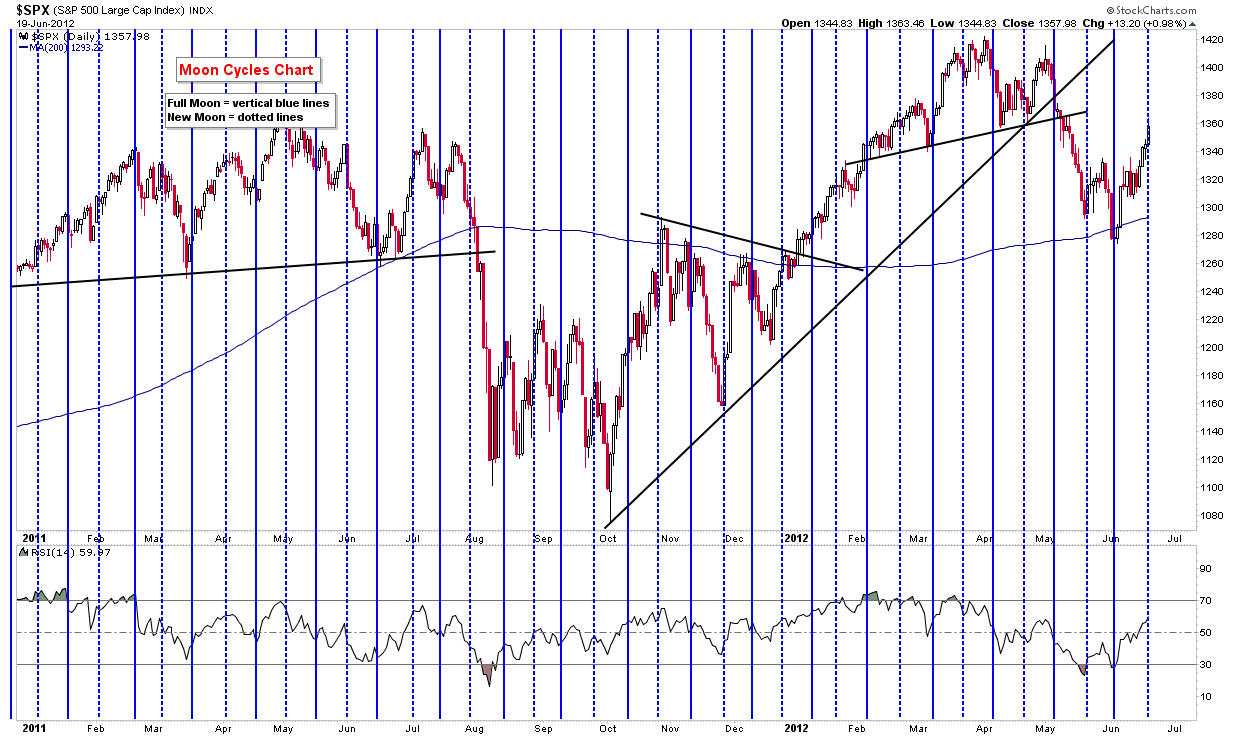
Here's a daily chart of the S&P 500 which shows both the full and new moon cycles, I've also covered this chart in the newsletters, you can find it in my weekend newsletter posted below.
Today the SPX closed right on the New Moon cycle date, will this produce a short term top? Possibly, at least lately the these cycles have tended to act as inflection points for the market.
Also remember that we have a FED meeting tomorrow and what Bernanke says will likely be a big catalyst for the market either causing a continuation of the rally, or decent pullback. Obviously if Bernanke doesn't make any mention of QE or other stimulus, the market will probably sell off.
No comments:
Post a Comment