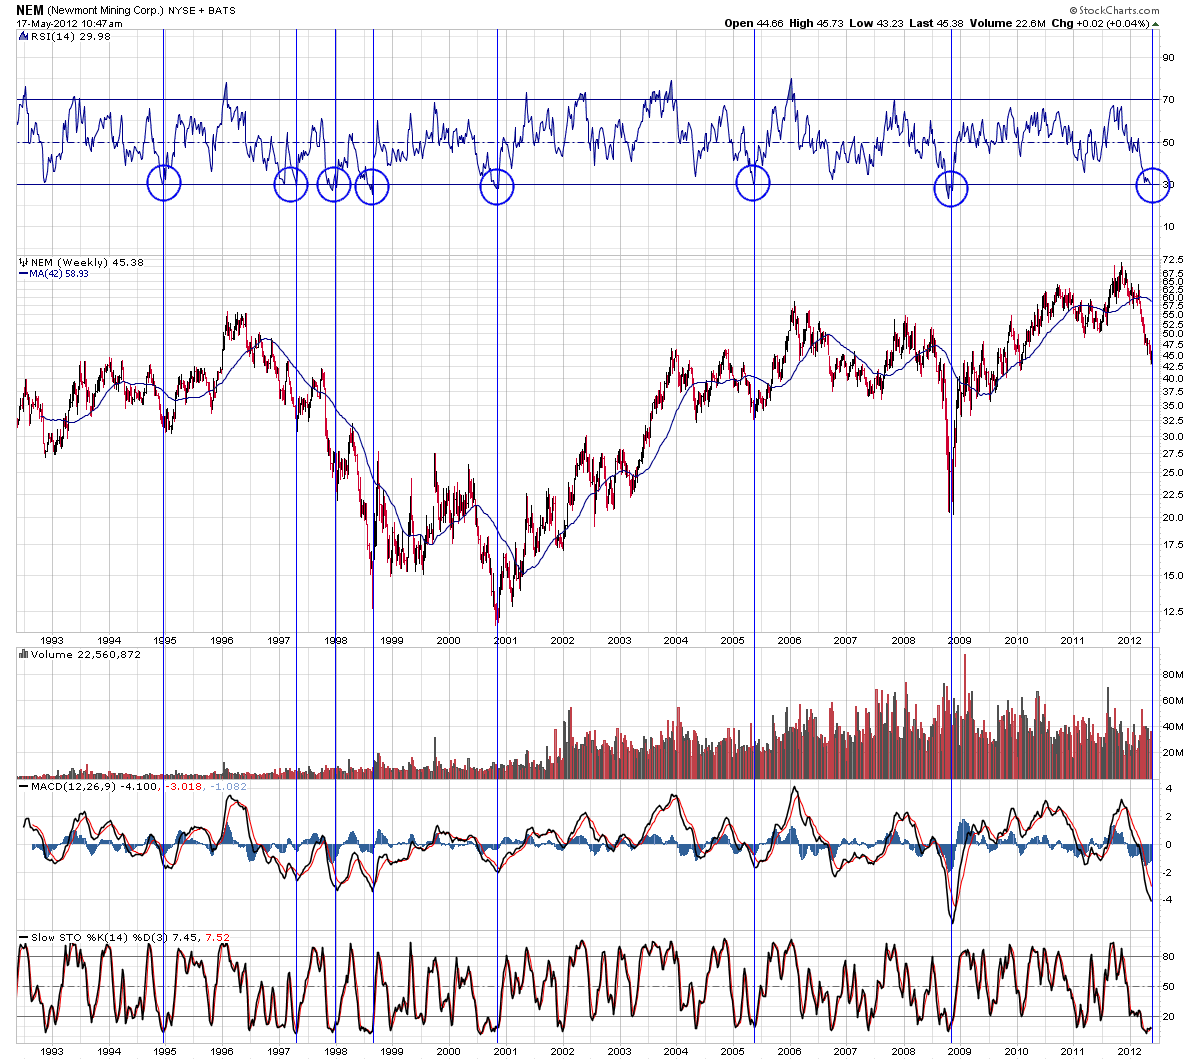
NEM - Chart Link - here's a weekly 20 year chart of NEM gold stock with the standard 14 period RSI. As you can see, over the last 2 decades, the weekly RSI doesn't get oversold (below 30%) very often, and generally when it does, it's due at least for an oversold bounce. In 2008 of course the pullback was the most extreme and the RSI become the most oversold, however prices eventually resolved to the upside. Notice that even during the late 1990s (1997 - 1998) that price was in a strong downtrend, however the RSI getting oversold always caused a decent bounce in all cases, even if prices continued lower afterwards.
Currently RSI is oversold again on the weekly chart. This doesn't mean that it can't go lower, I'm just pointing out that historically it's getting oversold.
No comments:
Post a Comment