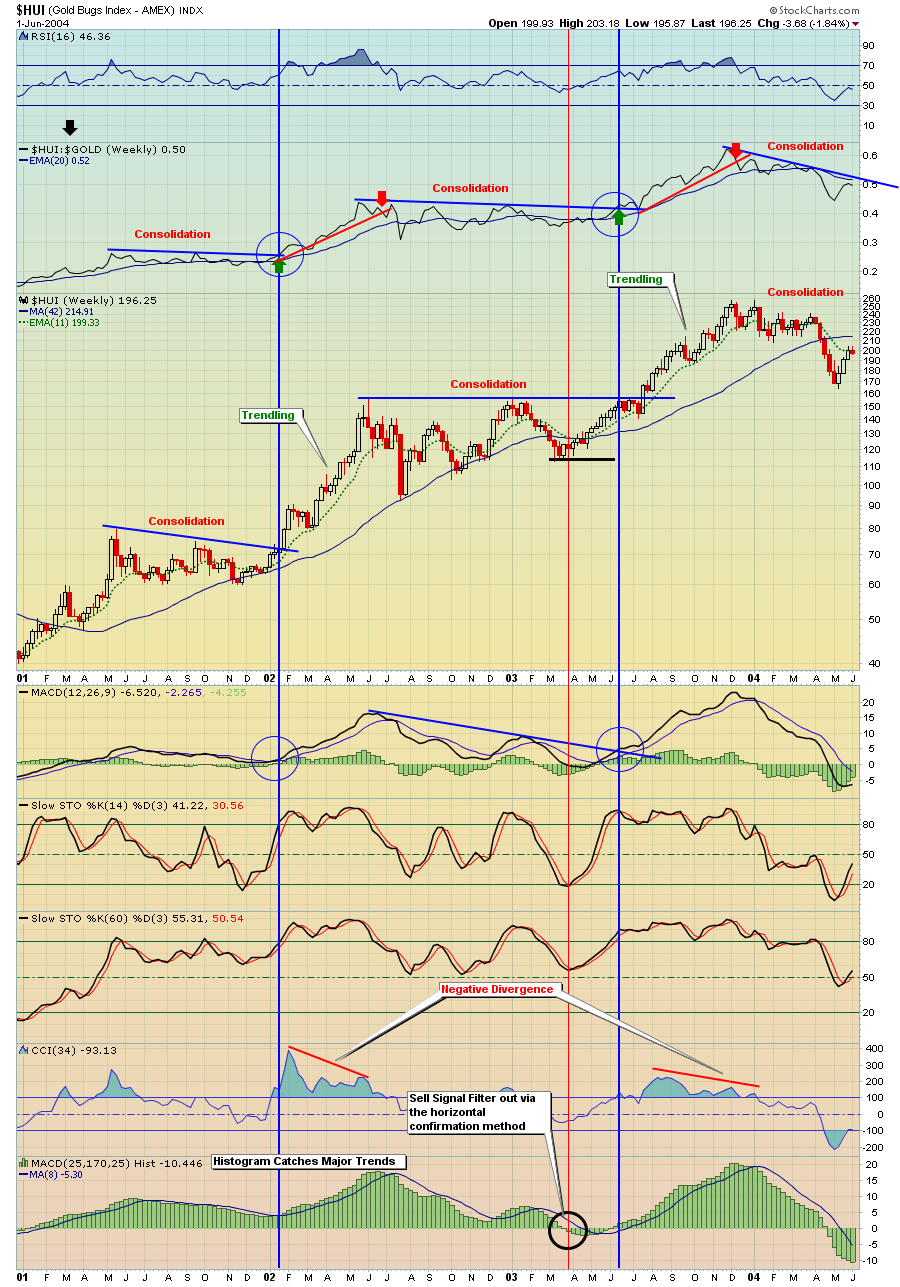
$HUI - Chart Link - HUI 2001 - 2003, very easy trading during these times simply following the HUI/GLD ratio, MACD crosses, and histogram
$HUI - Chart Link - HUI from 2003 - 2008 - Notice how the HUI started to under perform relative to the metal way back in late 2007 and early 2008 before the big crash, this was a warning sign. Now look at the ratio on the next chart, it stated down trending early last year!
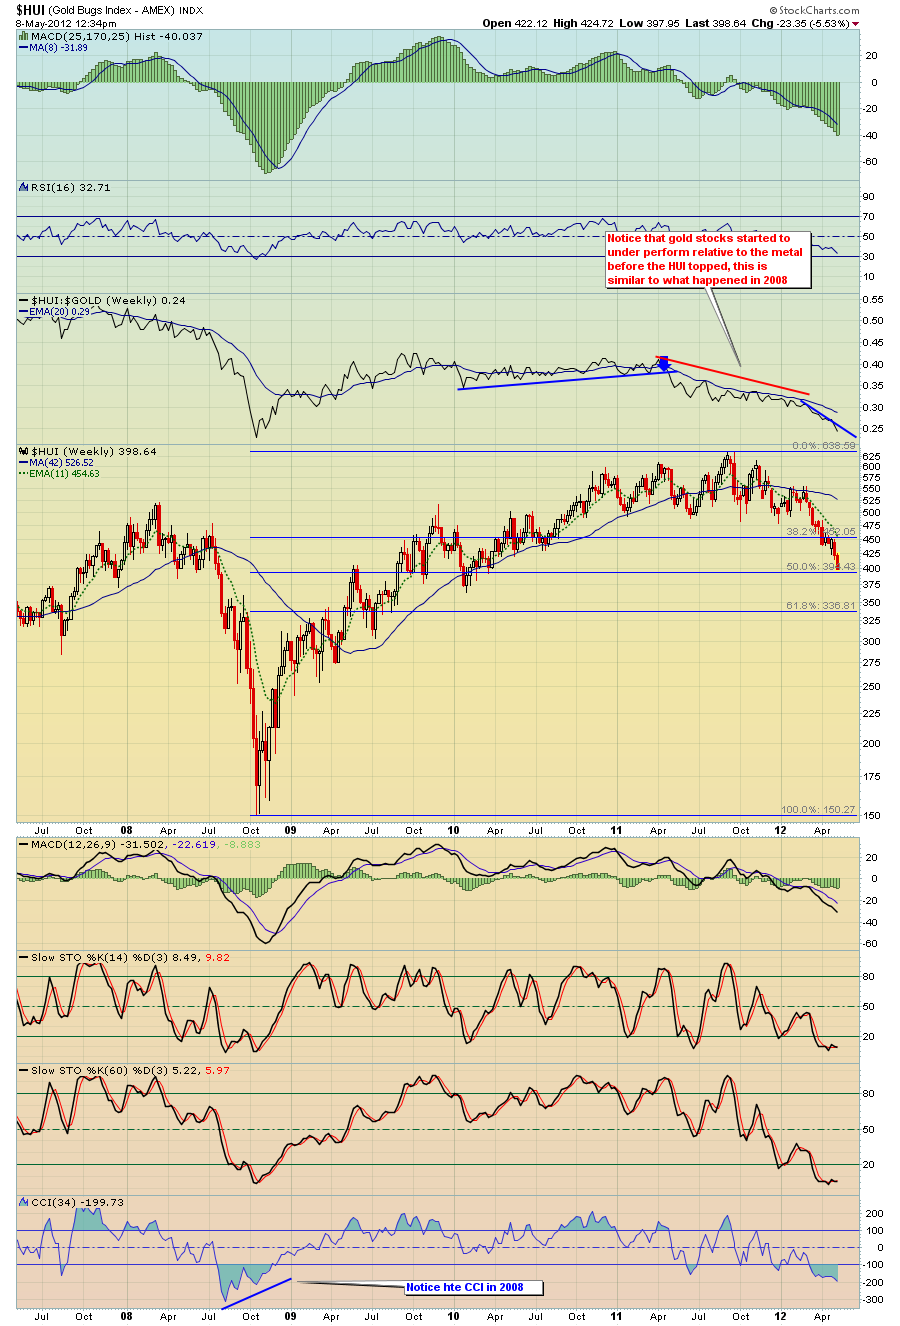
$HUI - Chart Link - HUI from 2008 - current - Notice that gold stocks started to under perform and trend down relative to the metal before the HUI topped in early 2011, this is similar to what happened in 2008. Anyway, the HUI is now at a 50% Fib, we'll see if it can hold in here or not.
This is why I follow the HUI/GLD ratio, the GDX,GLD ratios etc, I've found them very useful for the last 11 years.

No comments:
Post a Comment