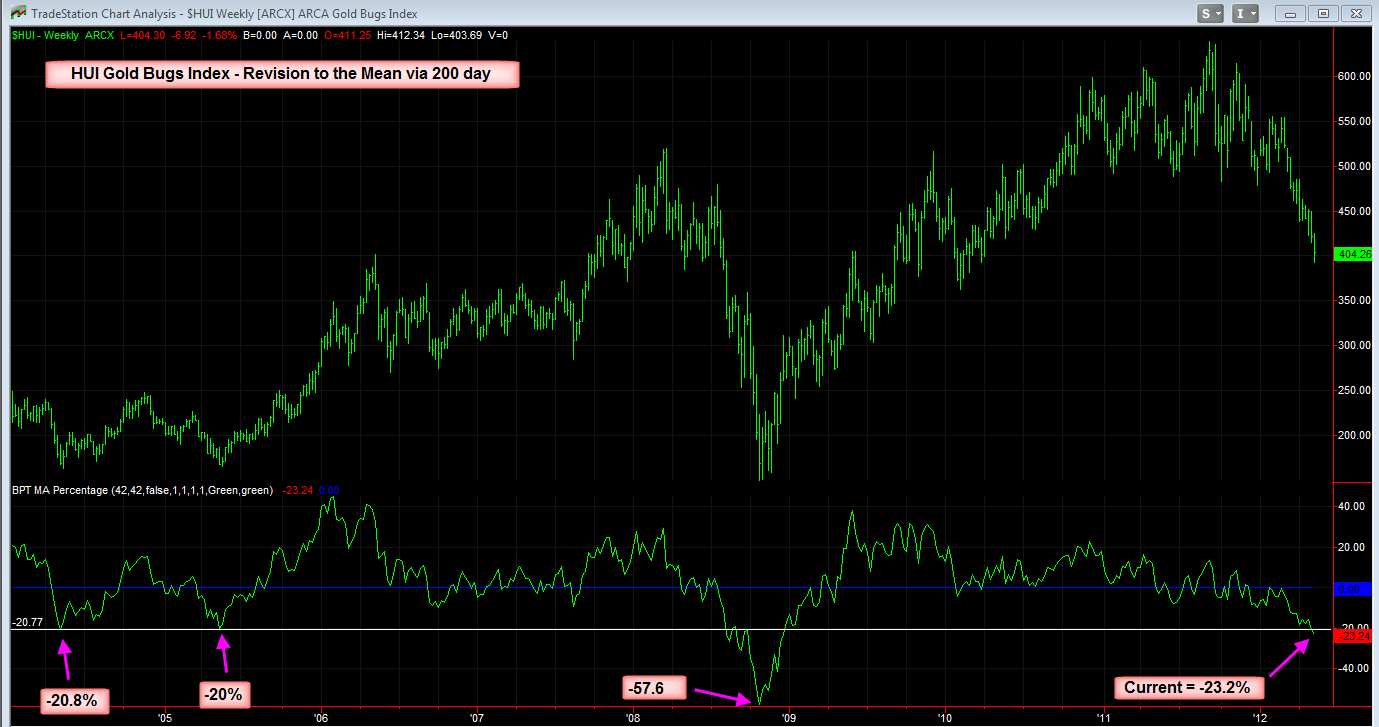
In the past I've posted a chart showing the HUI Gold Bugs index with my custom indicator which shows the percentage away from its 200 day MA.
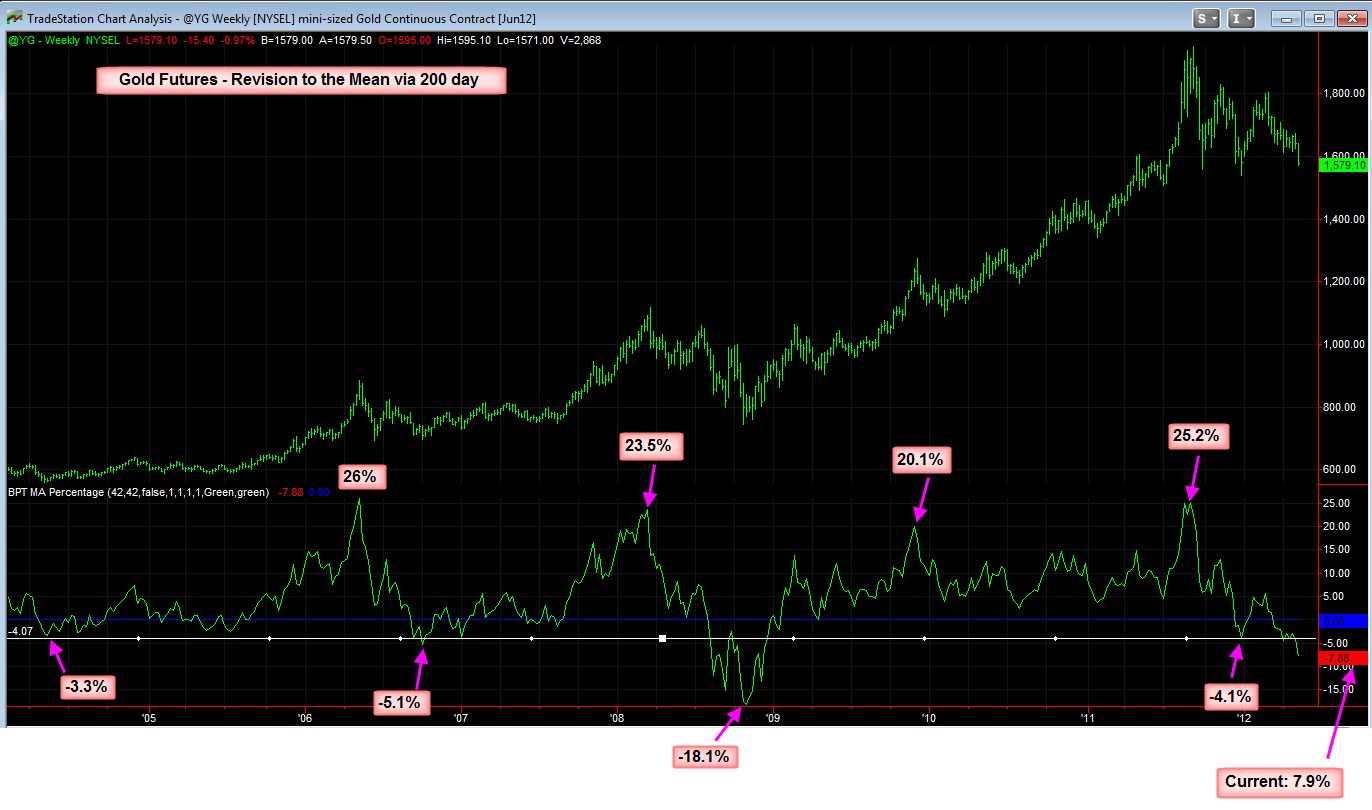
Here's a chart of YG Gold futures. Back in August of last year I showed a similar chart of gold when I warned of a top and a pending correction in gold since it was over 25% away from its 200 day MA. As you can see past highs have occurred in the 20 - 25% range above the 200 day MA.
However since gold is in a bull market (let's assume that it still is) the most of the corrections have been shallow falling only about -4 - 5% below the 200 day MA, except for the 2008 correction when gold fell to -18% below the 200 day MA.
Currently gold is -7.9% below the 200 day MA, therefore it's below the mean of the past corrections, so the question going forward will be how deep does it go.
Also here's the updated HUI gold bugs chart, currently the HUI is -23.2% below its 200 day MA, which is slightly below the 2004 and 2005 corrections, and of course well above the 2008 major correction lows.
It will be interesting going forward....
No comments:
Post a Comment