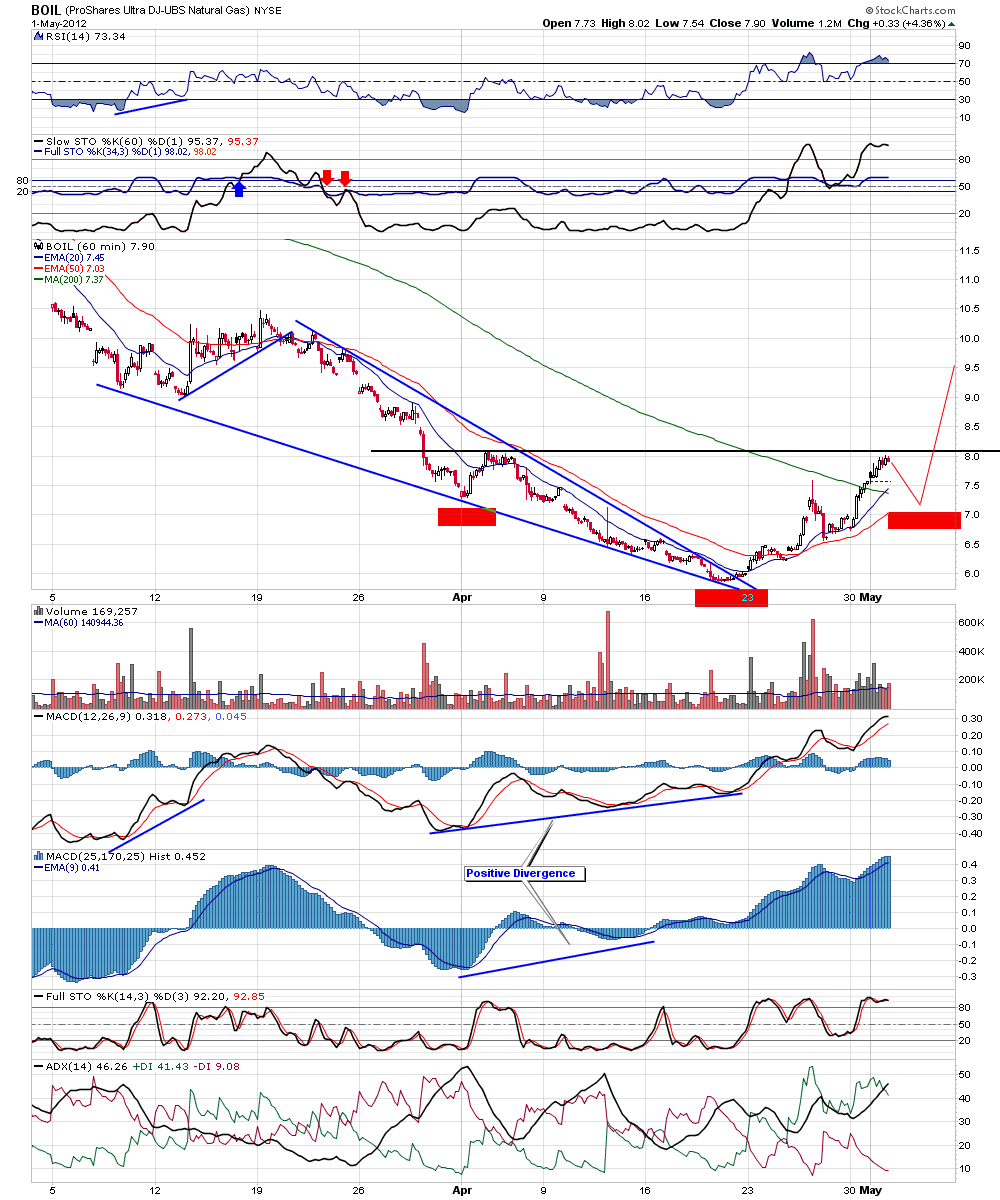
Here's a 60 min chart of BOIL, a pullback here could form a Right Shoulder of an Inverse H&S pattern.
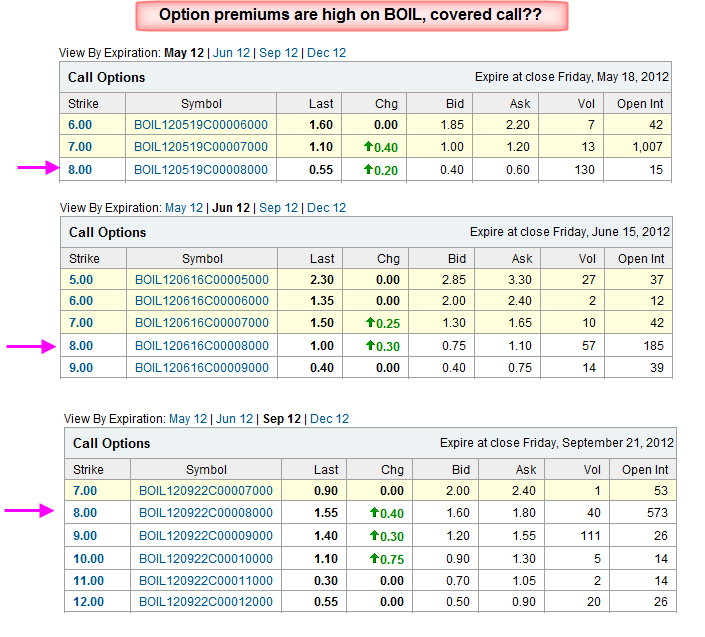
Also options are trading quite high for this ETF, here's a list of call and put options for May, June, September.
for example one could sell June 8 call options for 0.75 cents, with the spread I was able to get filled at 0.85 cents
For September you get $1.6 - 1.8, assuming you get $1.6, that's a 20% return if you are called out. Also this lowers your cost basis down to $7.6 - $1.6 = $6, therefore price has to fall below $6 before you start losing money. Of course your potential gain is capped, if by Sept BOIL is trading at $10, you have to sell it at $8, but you still make your 20%
No comments:
Post a Comment