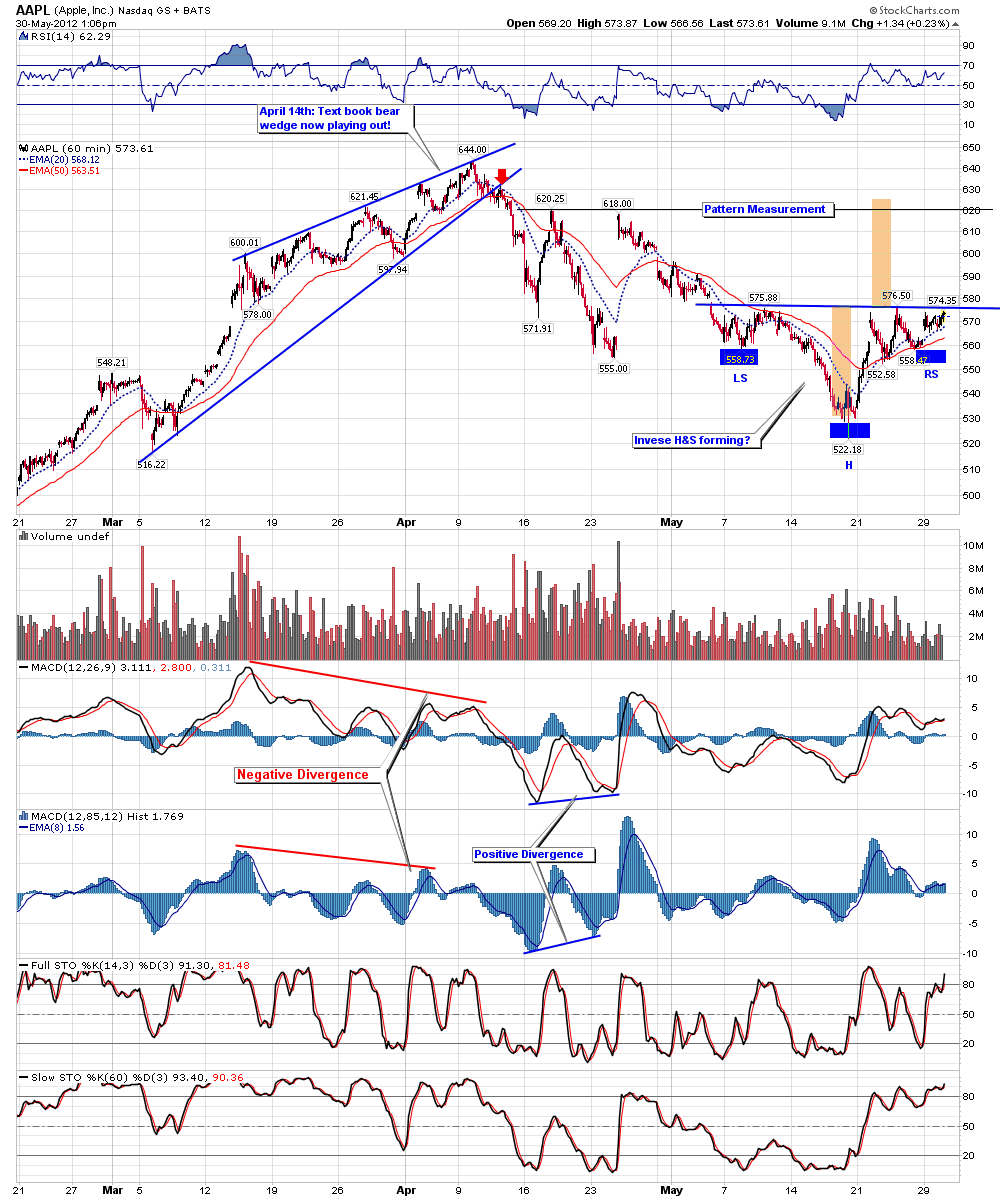
AAPL - Chart Link - As you know, the general stock market (SPX and Dow) have taking a beating recently and is down strongly once again today. However here's a 60 min chart of AAPL, as you can see, a potential bullish inverse H&S pattern is currently setting up, the pattern has a neckline at 566 - 567, with a measurement to about 620. APPL is holding up well today considering the sell off in the general market.
If you've been following my blog, you will recall that I called for a sell off in AAPL back in April as a very well-defined bearish rising wedge had formed with negative divergence (see the left side of the chart), clearly this pattern played out well for a short. Now let's see if this potential inverse H&S can play out. However this pattern needs to play out fairly quickly because otherwise the RS will become too wide with respect to the left shoulder.
Something to watch for anyway, we'll see.
And of course the General Stock market remains very weak because of the situation in Europe and the rallying US Dollar. Please consider subscribing to our newsletter to get full access to all of our market analysis and trade ideas.
No comments:
Post a Comment