So here's an interesting example to point out: As I sad I have a basket of these weekly ETF systems, I run two different systems on them, one reversion to mean and one trend following or breakoutt - so each ETF has two systems running on it on two different charts, so if there are 10 ETF's, there would be 20 charts, with 10 of them running the RVM system and 10 of them running the trend following system. At times you will get both systems long or short, or you can get cases when one is short and one is long.
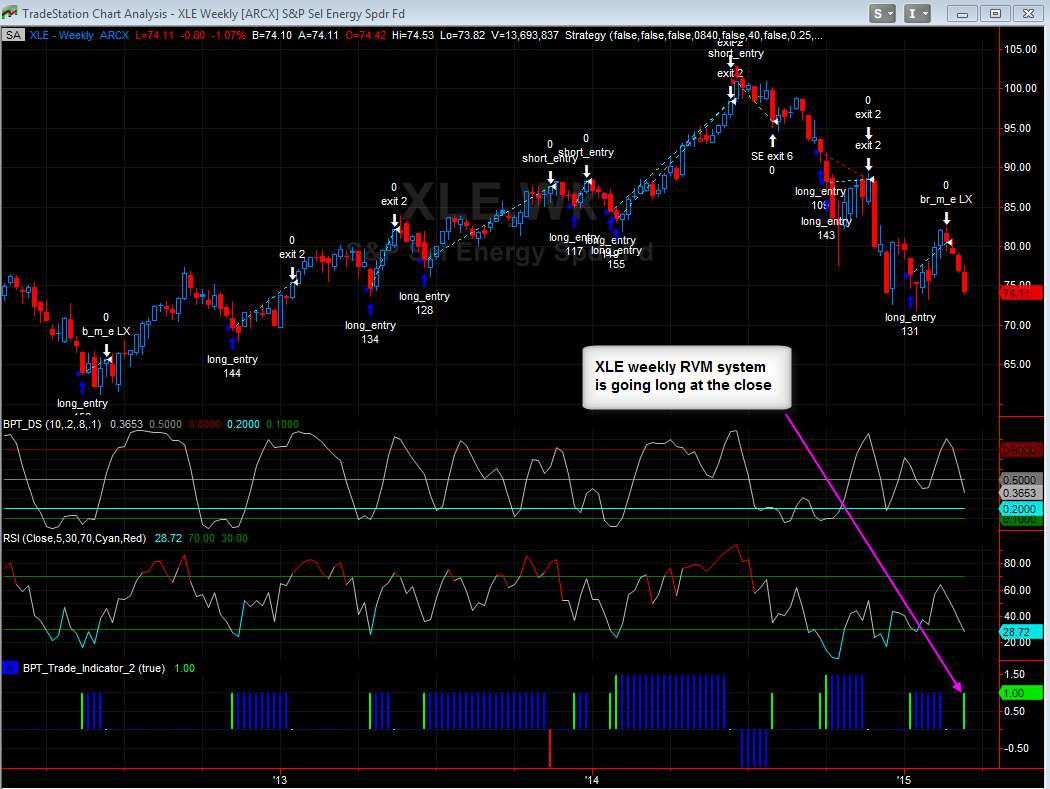
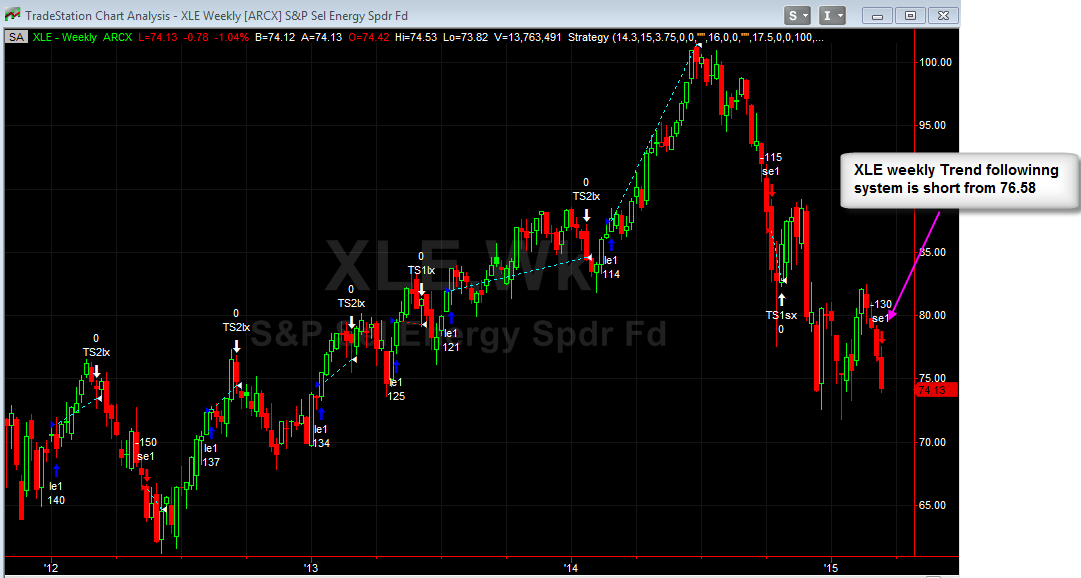
Here's an example on XLE, the energy ETF:
The first chart shows XLE running the RVM system, notice that it closed out a profitable long trade just over 3 weeks ago, however now it's going to go back long today at the close, see the green indicator bar at the bottom of the chart.
The second chart shows XLE running the trend following system, notice that it's already short, it went short at 76.58 on Monday, so it's up nicely.
Anyway what's going to happen when the RVM system goes long today at the close is that the short profit will have been locked in and you will have a 'Net Zero' position since they both cancel each other out. Should the market continue selling off and XLE goes to new lows, it cancels the early RVL long trade, or vice versa should XLE rally next week.
anyway just showing an example of what will happen at times once I release these systems, you will have trades that are both long and short at the same time
No comments:
Post a Comment