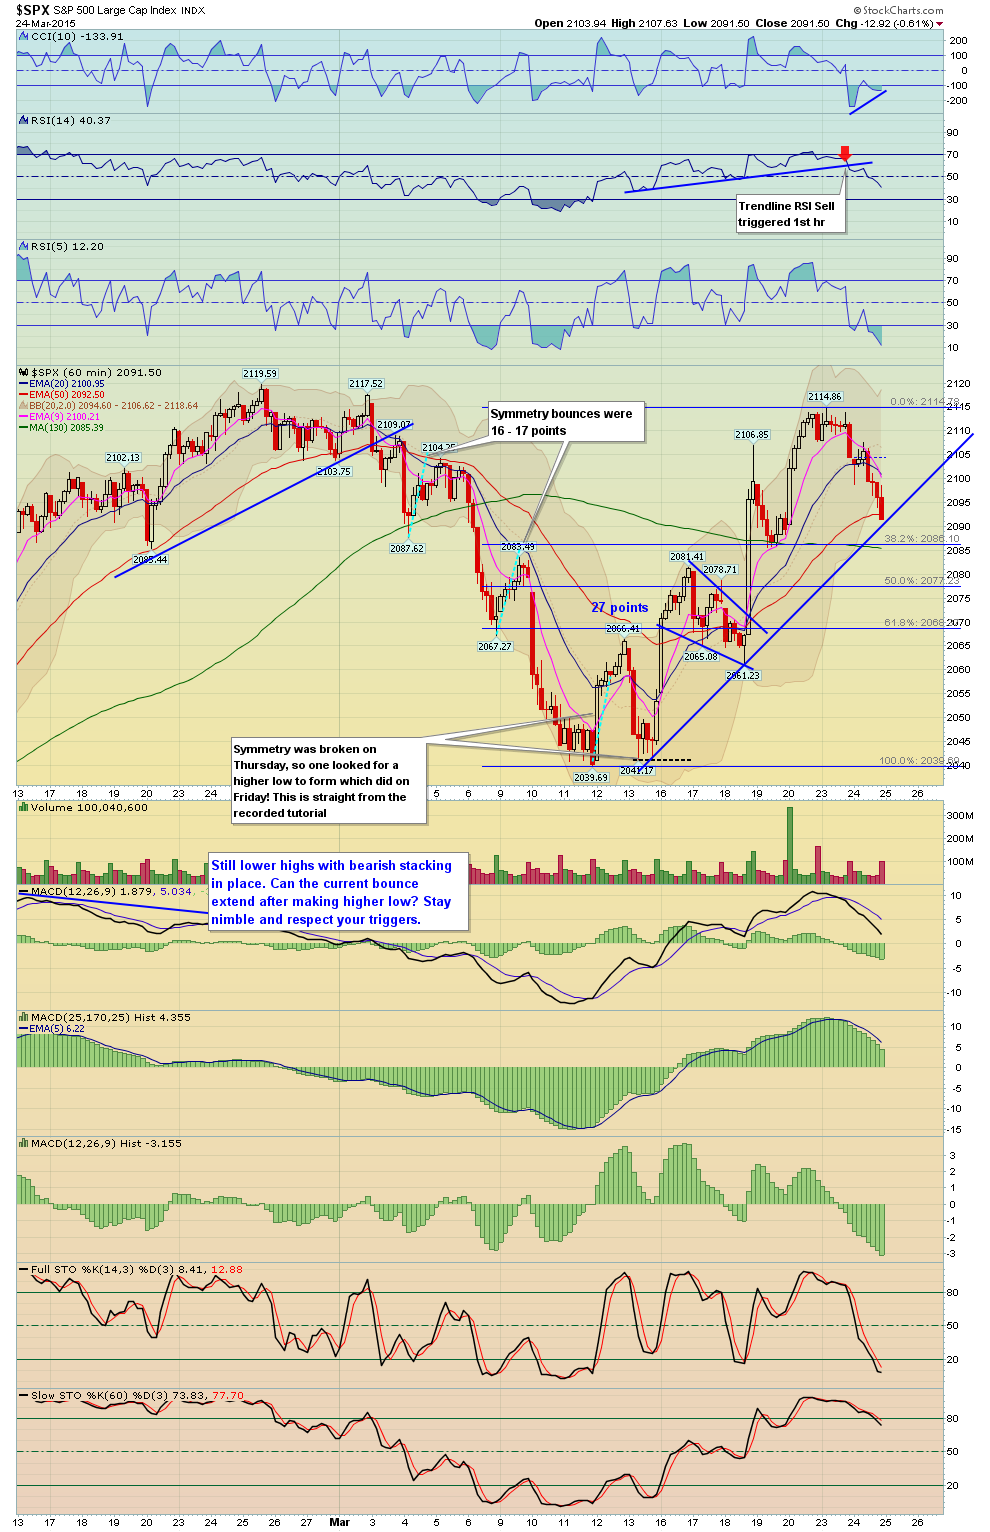
$SPX - Chart Link - with Fibs, first off that RSI trendline break occurred the first hr. Anyway an uptrend line from the lows here to monitor, some div on the CCI
$SPX - Chart Link - another view shows how a RS could form of a H&S pattern, notice we closed right on that uptrend line. However under this scenario notice the neckline would be slanted up, so another thing that could occur if there as some morning weakness (but not too much) that would allow the neckline to be flat vs slopped up, then bounce to for a RS.
again too much sell off would negate it and I'm simply throwing out things to monitor

No comments:
Post a Comment