As you know a while back on June 28th, I posted a weekly chart of AAPL, which showed that AAPL was forming a bear flag on its weekly chart. Here's a link to that post
Today as you know, AAPL reported earnings and missed, the stock is down after hrs. Perhaps this bear flag will end up playing out!
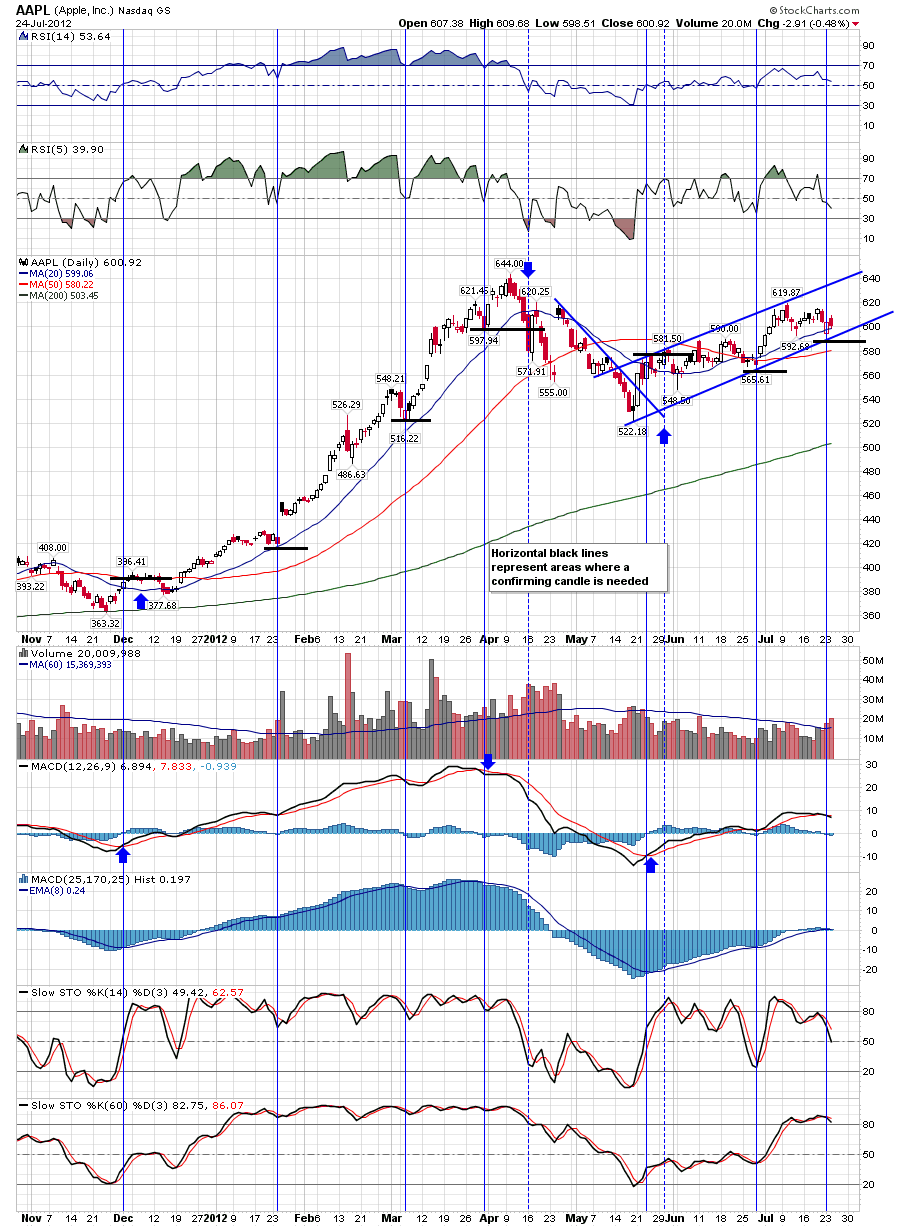
I've attached three charts, the first two charts are weekly charts, the first one shows a bear flag pattern; the declining volume on up move as well as the sluggish response of the MACD indicator is confirmation of this. The second chart shows another weekly chart and a long term uptrend line from the 2003 lows, that's long term support. The 3rd chart shows a daily chart, watch fro the uptrend line to be broken tomorrow on the gap.


No comments:
Post a Comment