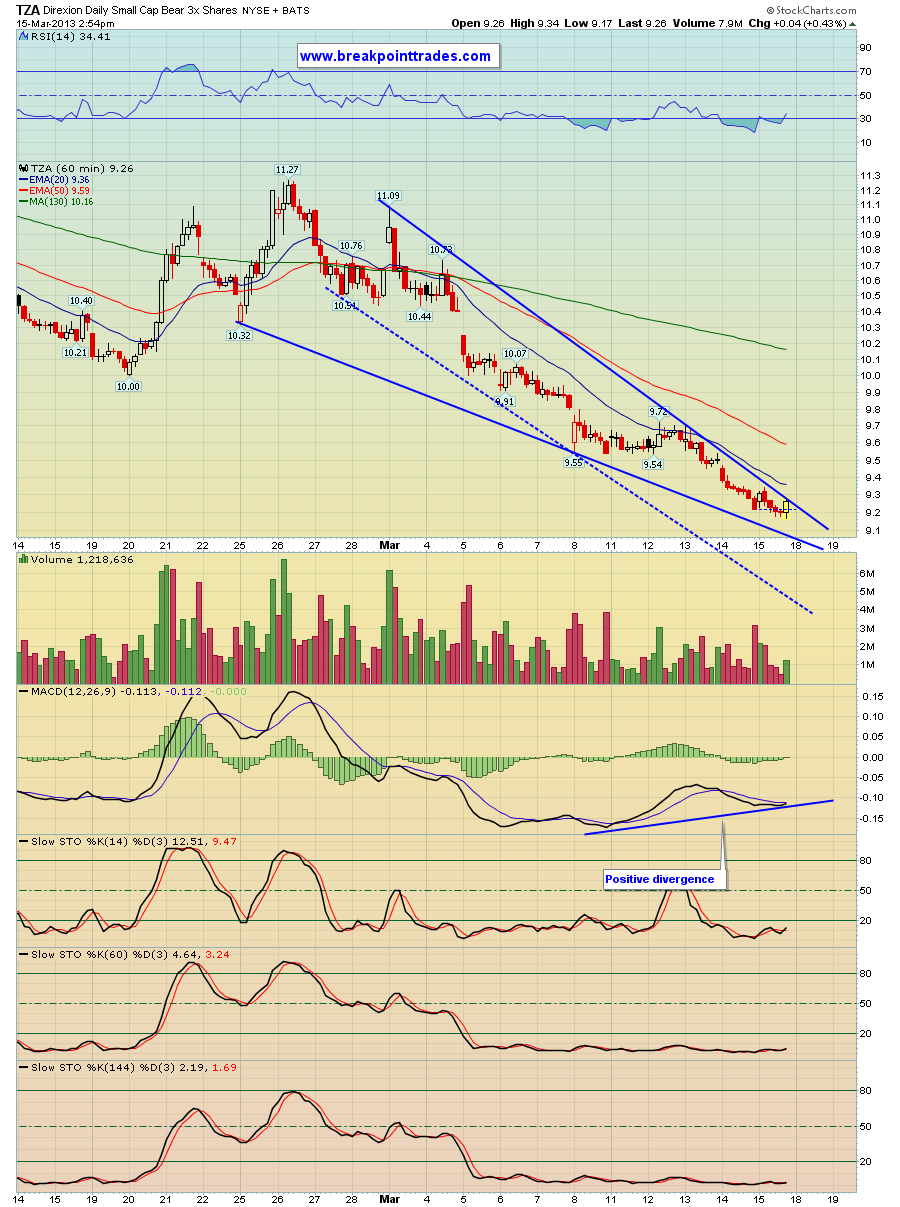
TZA - Chart Link - as you know, the SPX missed the all time closing high by a few points. Here's a 60 min chart of TZA, the -3X ETF for the Russell 2000. It has a bull wedge appearance that may provide an initial trade on a quick market pullback.
Newsletter Signup
Search
Followers
Blog Archive
-
▼
2013
(274)
-
▼
March
(28)
- Easter Commodity Newsletter
- NYSE Specialists dressed up as Easter Bunnies
- 1st Quarter Market Statistics
- Itch that needs to be scratched
- Gold stocks continue to be weak
- Mar 25th Market Newsletter
- Short term and Big Picture Market Thoughts
- APPL follow up
- NDX weekly - possible H&S top setting up
- Gold, Silver stocks
- Here\'s our most recent newsletter
- Wilshire 5000 index
- Precious Metals Newsletter March 17th, 2013
- TZA 60 min bull wedge forming
- Quick video on market tops and bottoms
- Our Recent Market Newsletter
- 5 consecutive closes outside upper Bollinger Band ...
- NEM weekly chart and RSI
- Short term market views
- S&P 500 daily and weekly views and follow up
- Thoughts on Gold stocks
- GDX - Chart Link - I keep getting pm question...
- Wednesday Mar 6th, 2013 Newsletter
- Gold Stocks bounced today - VERY oversold
- There are old traders and there are bold traders.....
- Money flow
- GDX RSI 2 oversold reversion to the mean follow up
- Weekend Newsletter Mar 3rd, 2013
-
▼
March
(28)
Friday, March 15, 2013
Subscribe to:
Post Comments (Atom)

No comments:
Post a Comment