I haven't commented on the market lately here on our public blog, however things are pretty much lining up like we projected! The first chart here shows a daily S&P 500, last year in December we showed this inverse H&S pattern (in green) which projected to about 1550 on the SPX - well the S&P hit that target today!!
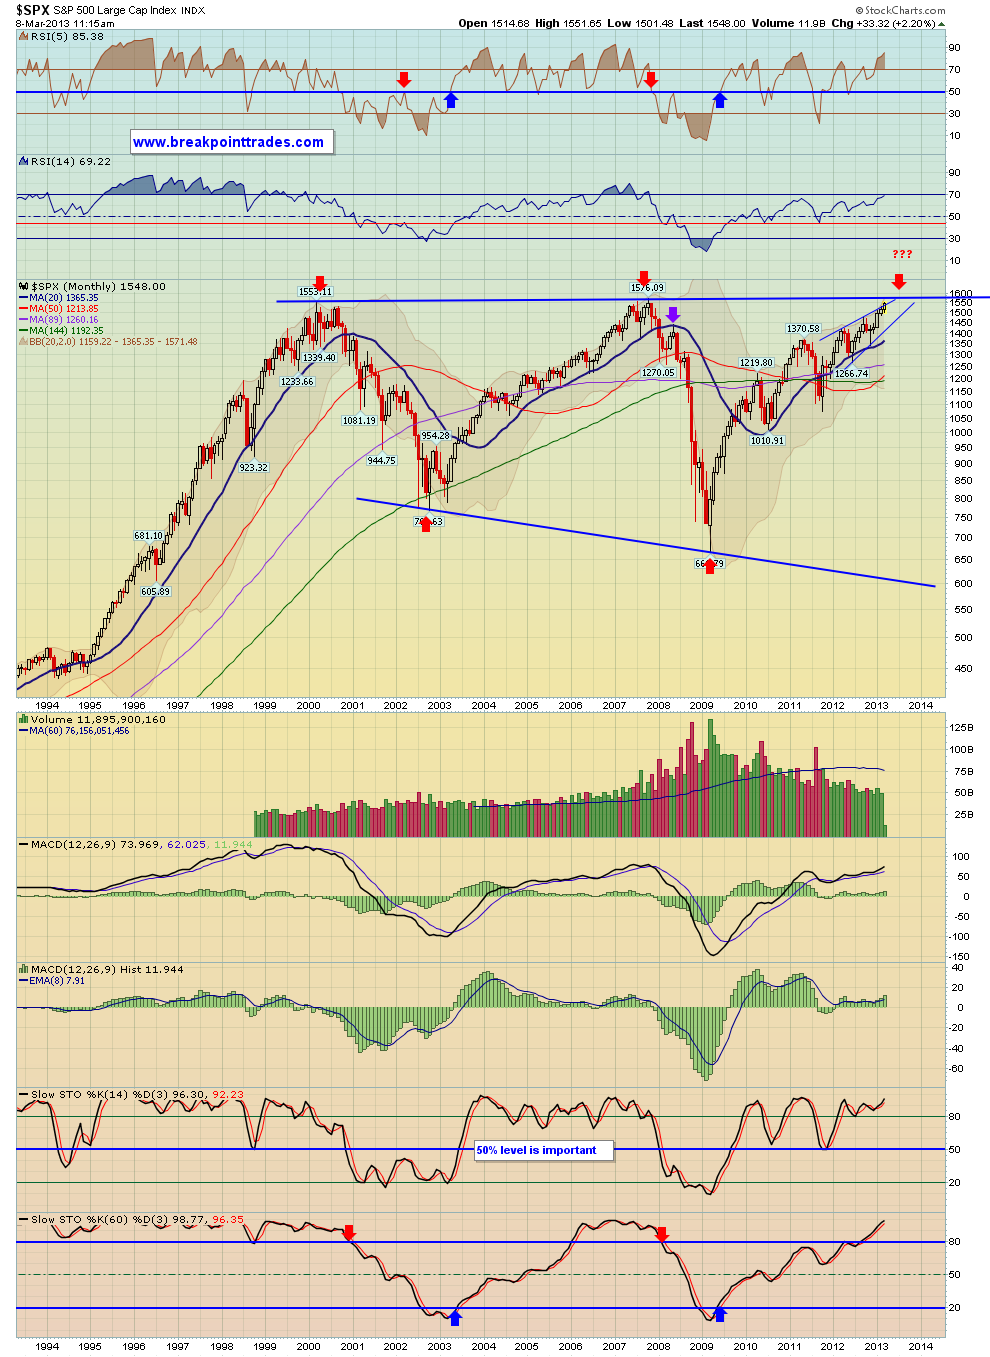
The second chart shows a monthly chart of the S&P, this is one I posted a while back as well - honestly I don't see how the SPX won't eventually test the upper long term trendline going back to 2000.
Otherwise shorter term, our thoughts are that the market is carving out a head to a H&S top for a sell off in April or May as the 'Sell in May and go away' will likely play out again this year. however after some summer chop and consolidation, I would expect the market to then do well in the fall and end of year. Then perhaps a bear market finally begins next year?

No comments:
Post a Comment