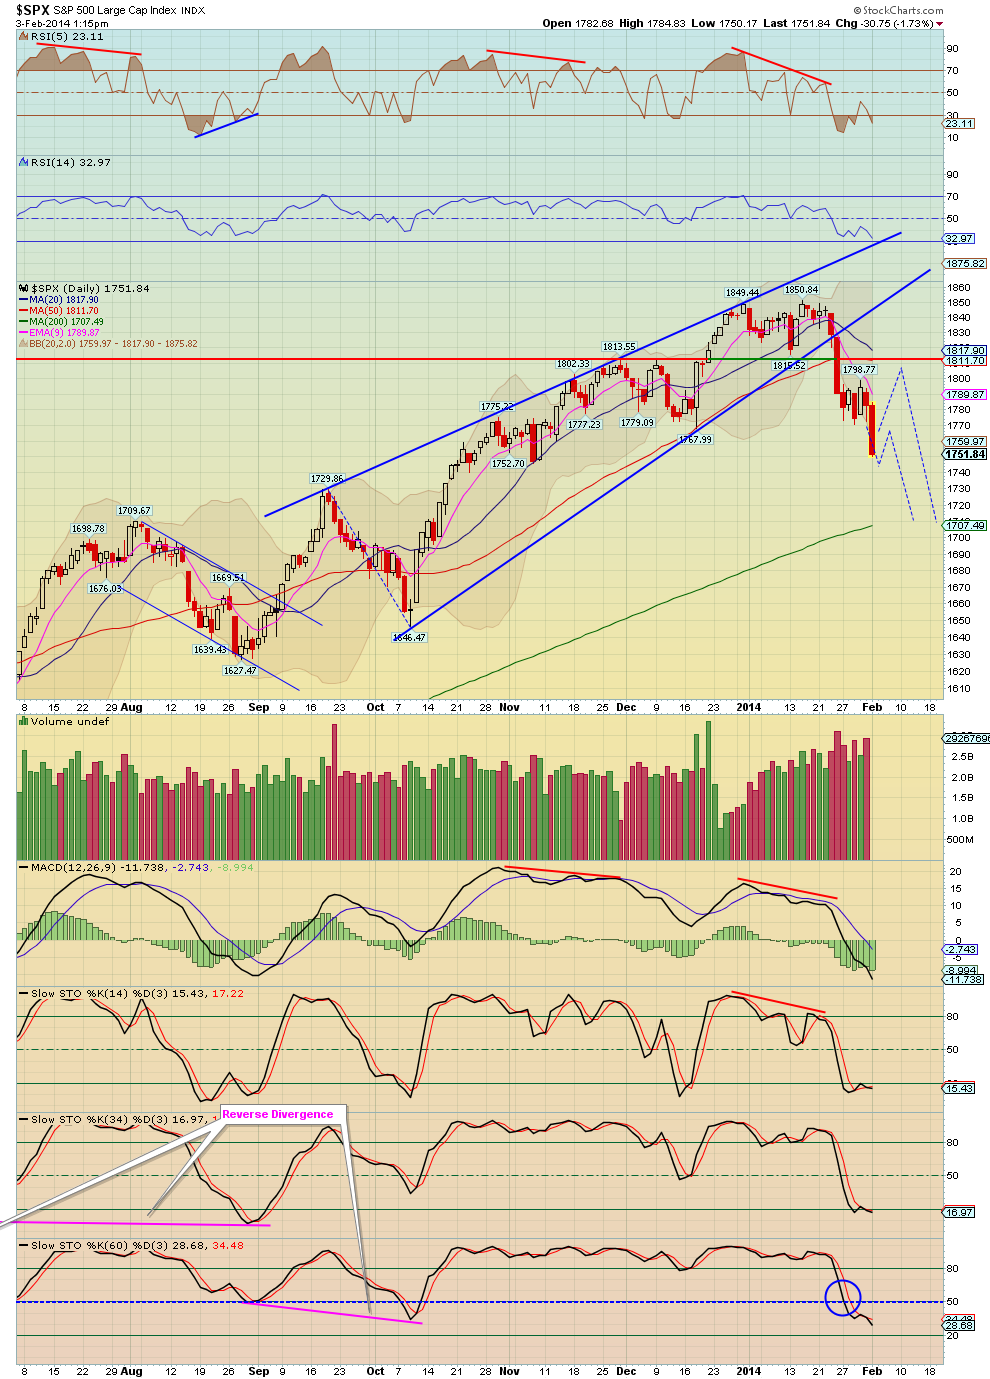
Jan closed the month red - that is a bearish start for the year and generally how the market finishes Jan is a good barometer of how the market will do for the year - so not a good start!
Anyway here's a few S&P 500 charts - a few weeks back we were showing a bear wedge developing on the S&P 500, clearly that's played out nicely now. Also OPEX clearly marketed a nice top in Jan (notice from the 4th chart how options expiration has been a good guide at marking infection points (tops and bottoms) in the market.
The S&P 500 is now testing an trendline line, see the second chart - if this trendline is lost the next logical support area is the 200 day MA - which by the way hasn't been tested in a long time and is over due.
I've you've listened to my newsletters, I've stated many times over the last 1 - 2 months that I think the market will have a 10 - 15% correction or more in the 1st quarter of this year or in April/May which is typically the weak time of the year - maybe it's starting?
We are now 5 years into this bull market which began in March 2009, getting a bit long in the tooth - 2014 won't be the 'cake walk' that 2013 was, the gains will be much harder.
stay tuned...


No comments:
Post a Comment