Our GDX mechanical systems are currently up over 11% on this trade! Long was entered on July 27th.

Our GDX mechanical systems are currently up over 11% on this trade! Long was entered on July 27th.
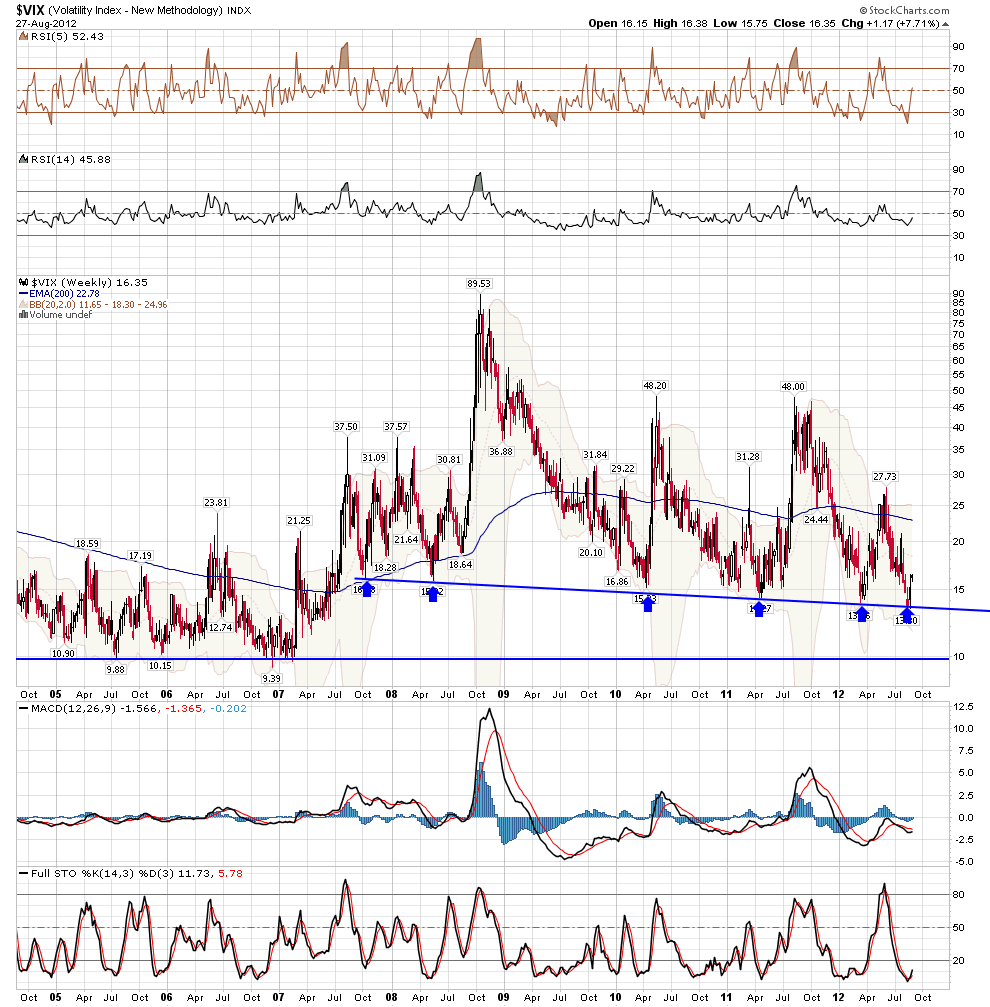
Last week I posted this VIX charts and so far the market has pulled back nicely off the highs.
The first chart shows a weekly VIX chart, as I've been showing, it had come back to a long term weekly support trendline, and logically it has bounced off it.
The second chart shows a 60 min VIX chart, as I showed last week, a well defined inverse H&S pattern was forming and now price is into the gap zone (in yellow).


Hello everyone, here's tonight's newsletter, please be warned that it's
very comprehensive, however it contains a lot of educational material
that I have covered in my tutorials with my students. I have now had
personal training sessions with about 50 members over the last month
with sessions lasting 2 - 3 hrs, helping our members with their trading
and objectives. Additionally if you would like to schedule a FREE
educational session with me after hrs, please feel free to contact me and set up a
tutorial. Each tutorial is tailored to everyone's individual's need's. Here's my email: smnelly@gmail.com
You can view the newsletter here.
Also please consider taking advantage of our 25% off sale, which expires on Aug 31st - see the details in the newsletter.
Best to your week!
Steve Nelson
I showed this VIX chart a couple weeks back testing the major support trendline, as you can see it bounced off.
First off I hope everyone had a nice weekend! Here's my very comprehensive weekend commodity newsletter with a large focus on the precious metals area, enjoy!
This most recent newsletter of ours is comprehensive including some educational material...please review when you have time. This shows you a snippet of what I have discussed in the member tutorials. We won't be spending time each newsletter doing this so make sure you have a grasp upon such things if trading. We will be focusing on providing the setups but you must have an understanding of how to trade them in accordance with the setup and your objectives.
Tuesday August 21st, 2012 Newsletter
Also please consider buying a membership at Breakpoint Trades; currently our 6 month membership is our BEST deal at roughly 50% off our normal monthly membership price.
Today the SPY and SPX pulled back exactly off the upper trendline of the bear wedge. Last night in my newsletter I stated that the upper trendline provide a low risk short. This morning the market was up and intra day tested the upper trendline; this was pointed out in our real time blog today.
In tonight's newsletter we will discuss what to look for in the market going forward; in the short term the market is at an important juncture.

Over the weekend I played around with the BPENER, MACD and other things, and came up with a system for ERX (3X Energy ETF). I'm not finished with it, however the statistics are a little ridiculous to say the least. Since it's a trending system, it does better when the market trends vs chop, hence why it would have made about 160% in 2009 and 200% in 2010, and was more choppy in 2011

Here's our comprehensive recent newsletter which gives a broad view of the market, Bonds/Interest Rates, Commodities, Gold and Gold Stocks, and some individual trade ideas
Here's an an example of one of our Very comprehensive weekend newsletters; this one contains 75 charts with the majority of the newsletter focusing on the precious metals area, however the first part covers general commodities and the energy sector. Breakpoint Trades offers the most comprehensive Technical Analysis that you will find on the Net!
We first showed this chart last year to our members; It's quite amazing the symmetry here and how the elliptical pattern has exactly followed each major top/peak of the market rally following the bear market 2009 bottom. Going forward it will be interesting to see if the SPX can once again test the upper parabola this year. Also note how the 14/3 Stochastic is now getting overbought again, therefore I do not think the S&P 500 will be able to break out of this pattern and will once again turn back down near the upper parabola.

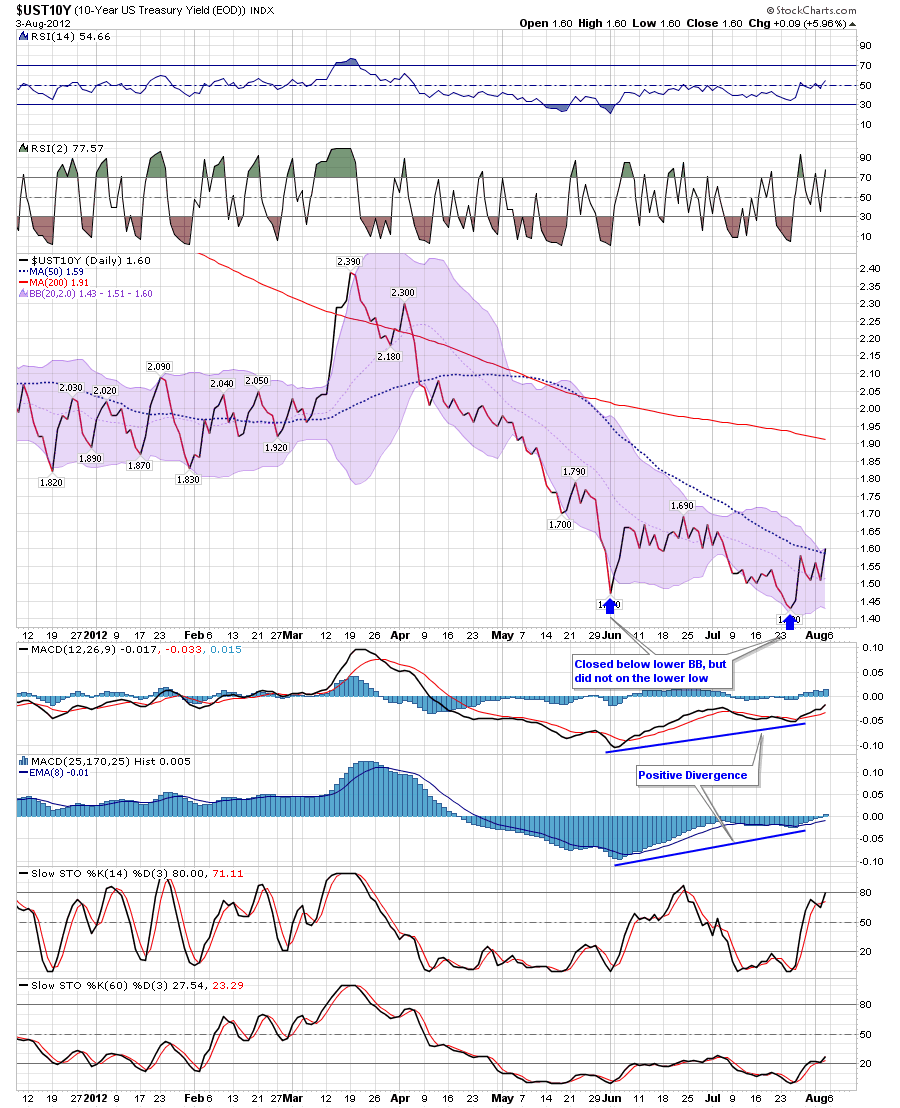
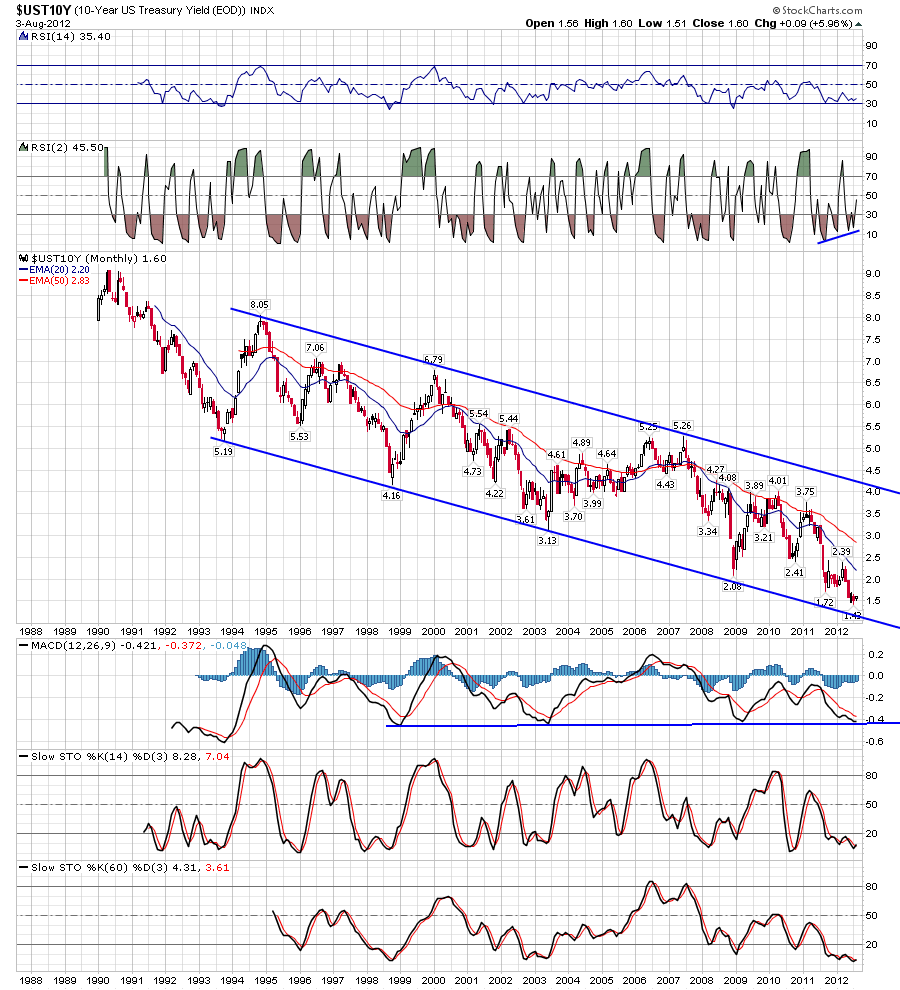
Here's a few charts of the 10 year treasury yield. Chart #1 below shows you a chart of the 10 year Treasury Yield, as you know it recently rallied off the divergent low and bull wedge that had formed.
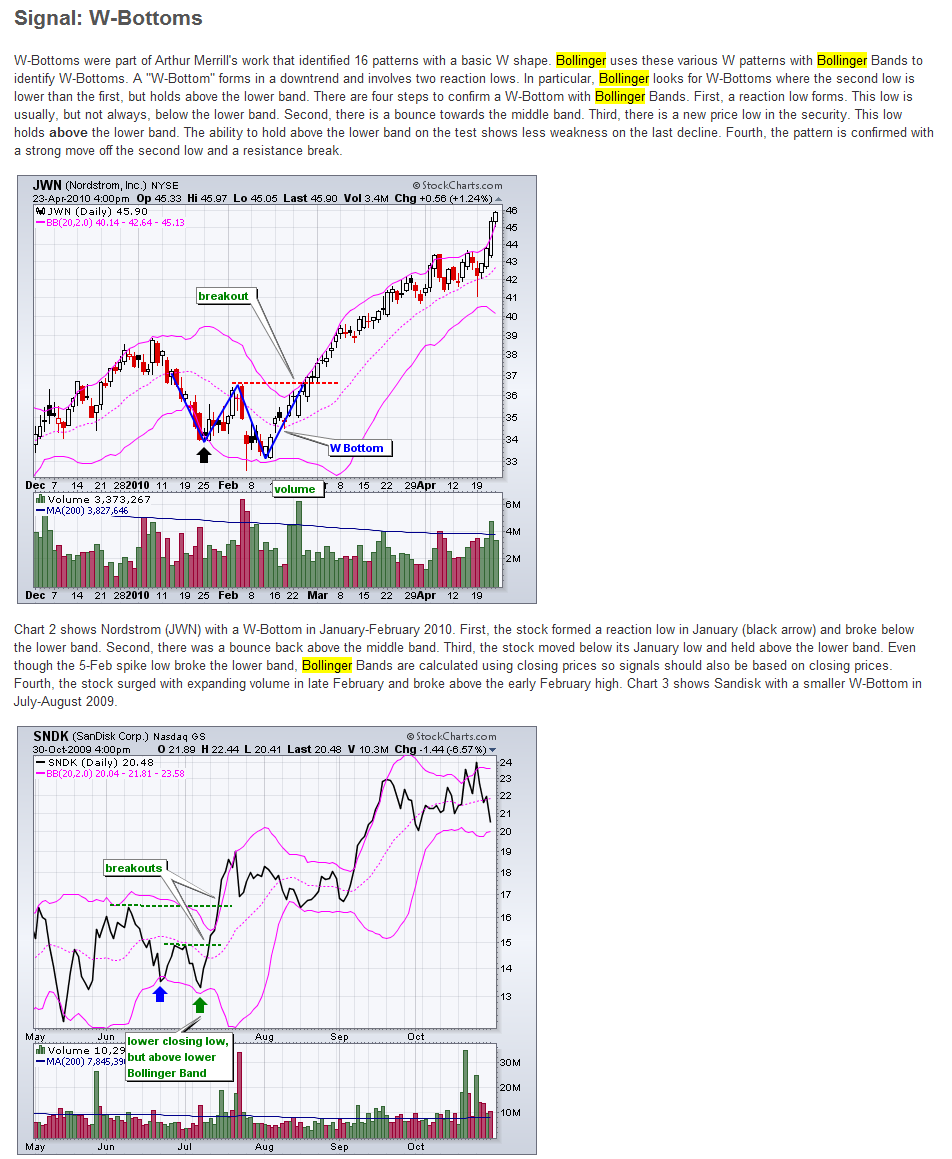
The second item below shows a graphic exerpt from the Stockchart.com Education section on Bollinger Bands (Here's a URL to the Stockcharts.com Education section which discusses Bollinger Bands and John Bollinger who created Bollinger Bands, in greater detail), it shows two bullish examples of when a stock forms a lower lower, however does not close below the Bollinger Bands on the lower low. This is something we also showed in April as an educational piece.
However as you see in the chart below the graphic, which shows another daily 10 year yield chart but this time I include the Bollinger Bands, note that a similar thing also occurred with the recent divergent low i.e. price closed below the Bollinger Bands in early June, but did not in late July when a lower low was established.
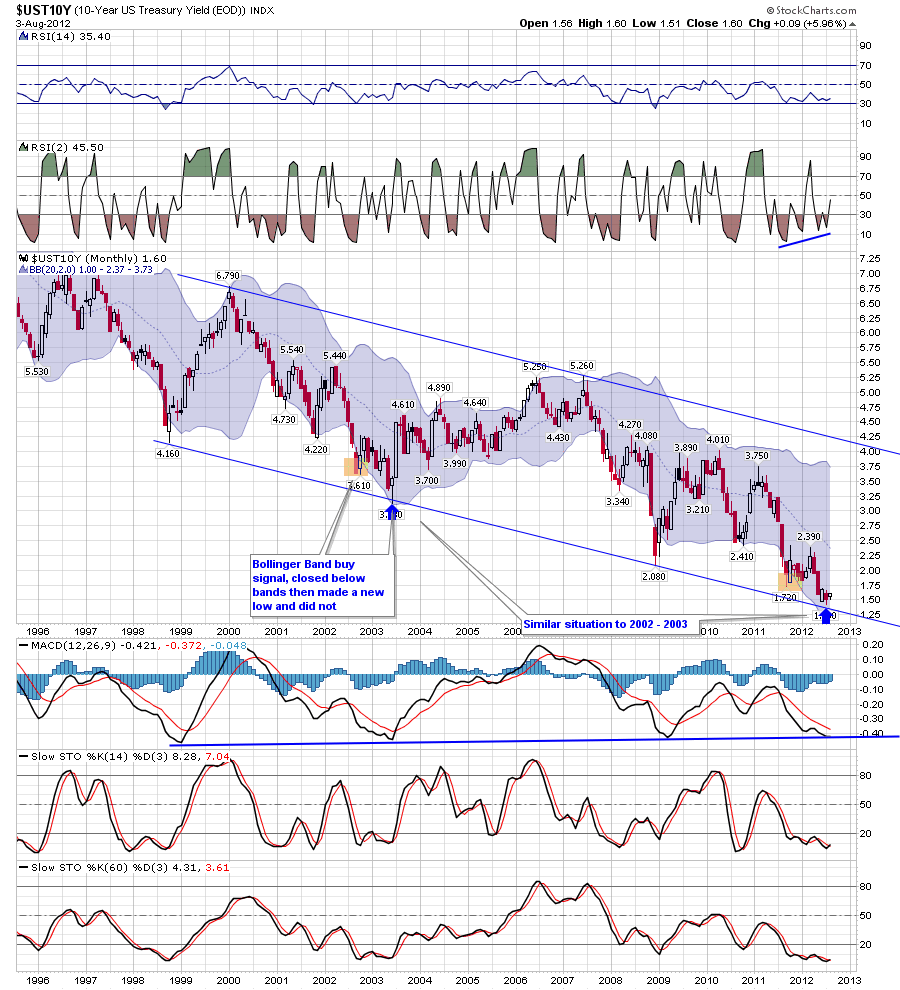
Charts 4 - Also note you also have a similar thing occurring on the long term monthly chart.
Chart 5 - I also show a 25 year long term chart as well

Here's an interesting and definitely eye opening interview with David Stockman, the former director of the Office of Management and Budget under President Ronald Regan.
This market remains extremely difficult to trade with big volatility as a result of the market being a slave to economic news especially European news and central banks. In short the market is like a drug addict or crack whore while the central banks are the drug dealers. The market has been reacting violently with strong short term moves both to the upside and downside since the June low on any mention or hint of quantitative easing from European central banks or the us Fed. Even though the market is up nicely off the June lows, it has made swing trading difficult for most traders unless you just bought in early June and held your nose.
We have had a lot of great trade ideas and most of them have provided profitable trades (both longs and shorts), however the traders who have done the best are the ones who have taken profits quickly - this is a market , using a baseball analogy, it has been best to shoot for singles rather than home runs.
The short trades that I provided last week provided winning trades and have bounced back on Friday, however for now they still remain viable.
We of course also have a slew of long trade ideas, please visit our website and sign up to our free newsletter in order to see our trade ideas
60 min chart comparison of the major indexes Dow, SPX (large caps), RUT (small caps), and Nasdaq (techs). Not the best sign for the market with the RUT and Nasdaq lagging


