Newsletter Signup
Search
Followers
Blog Archive
-
▼
2015
(1142)
-
▼
September
(81)
- NYMO McClellan Oscillator Mechanical system - the ...
- China PMI this evening, lately that's been moving ...
- SPX 30 min follow up, broke out of that channel, y...
- SPX daily yesterday formed doji candles, today lar...
- RUT and IWM 15 min views, possible little Inv H&S ...
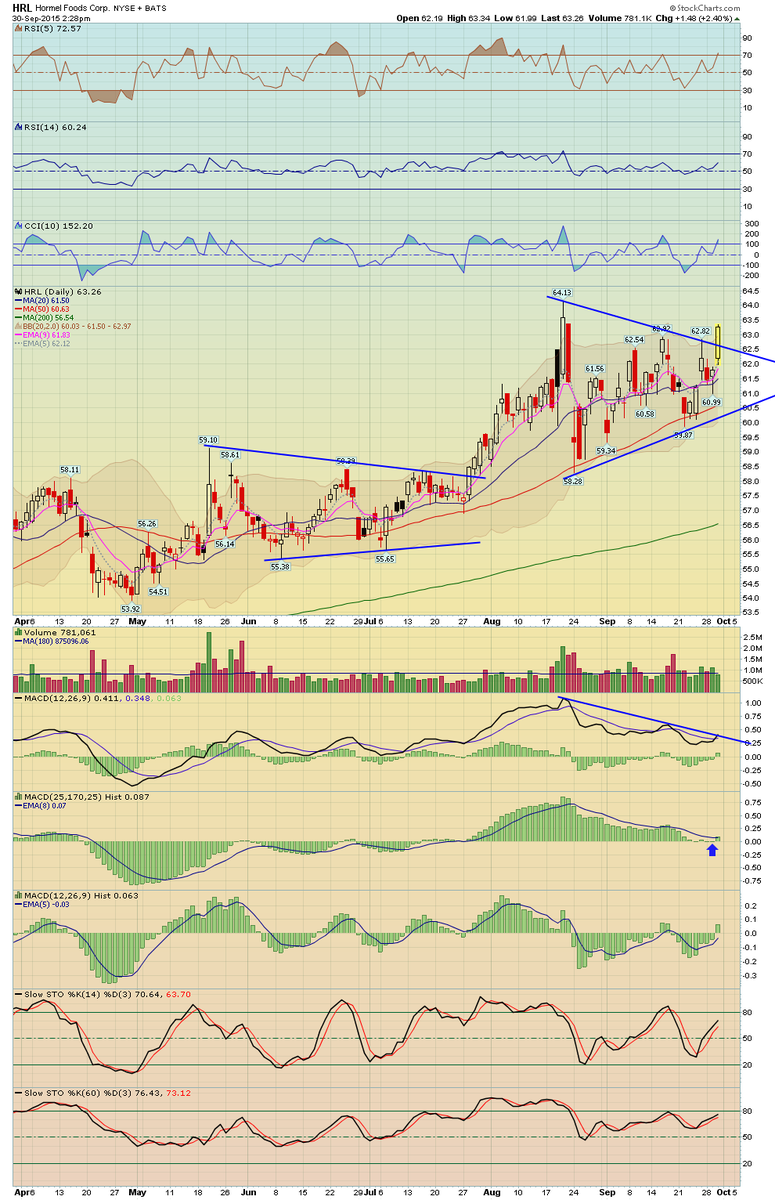
- HRL long idea follow up, broke out of the triangle...
- SPX 30 min view, price formed a bull flag and boun...
- SPX 60 min updated view, a perfect kiss of that br...
- SPX 60 min view, bounced up to the trendline resis...
- Nice rally from the perfect doji candlesticks on d...
- HRL trade idea, price is coiling into a large tria...
- Update on BG posted earlier, some vol came into it...
- follow up to that 3 min triangle pattern, as you c...
- SPX 3 min, normally I would not post this short of...
- BG long idea, basing pattern holding up for now, a...
- 60 min view of SPX cash, bounced this morning from...
- if a doji forms, we have a precise mechanical stra...
- So far doji candlesticks forming on the daily SPX ...
- AAPL short idea follow up, been on our short list ...
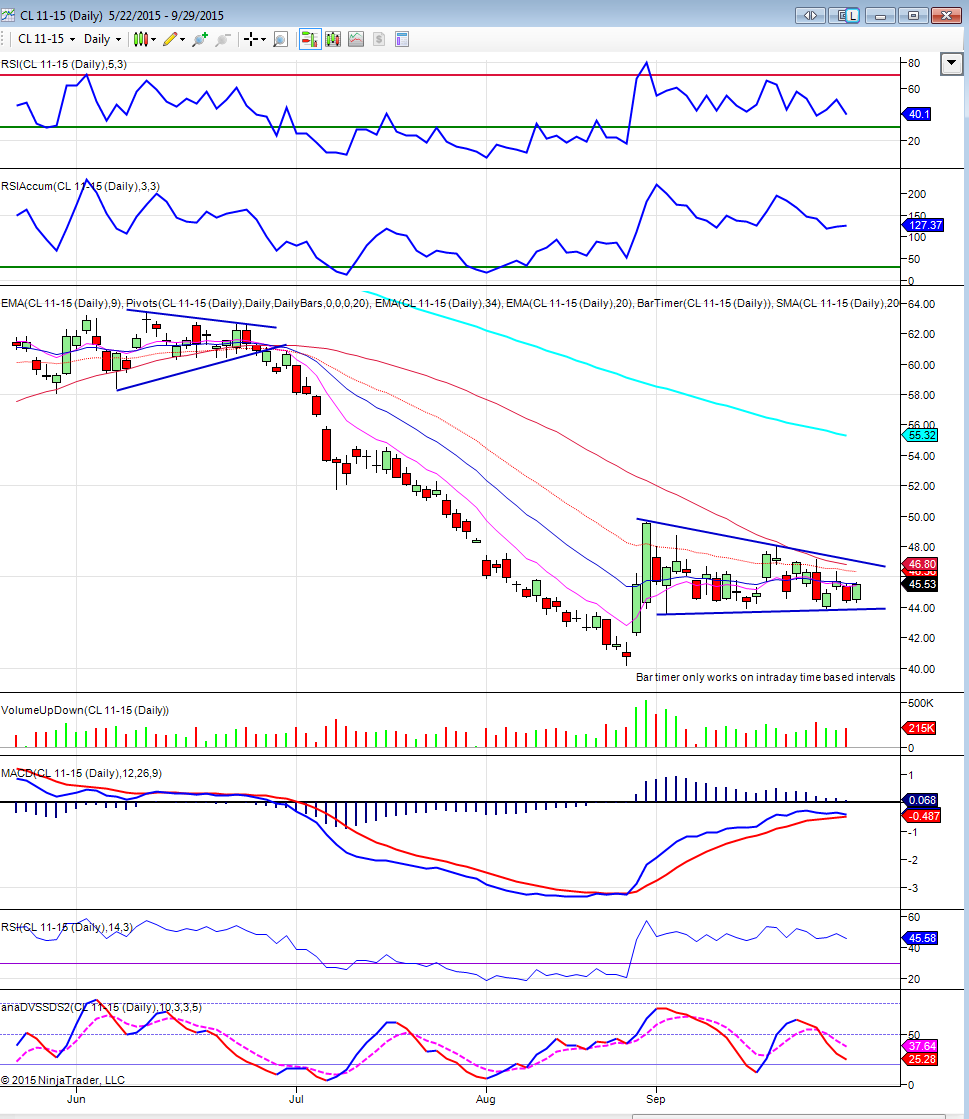
- Crude Oil getting tighter than a drum, building up...
- The NYMO McClellan Oscillator closed below it's lo...
- Perhaps some capitulation/washout is occurring in ...
- SPX monthly view, I find this chart fascinating ho...
- SPX cash daily views, note the Aug lows and the da...
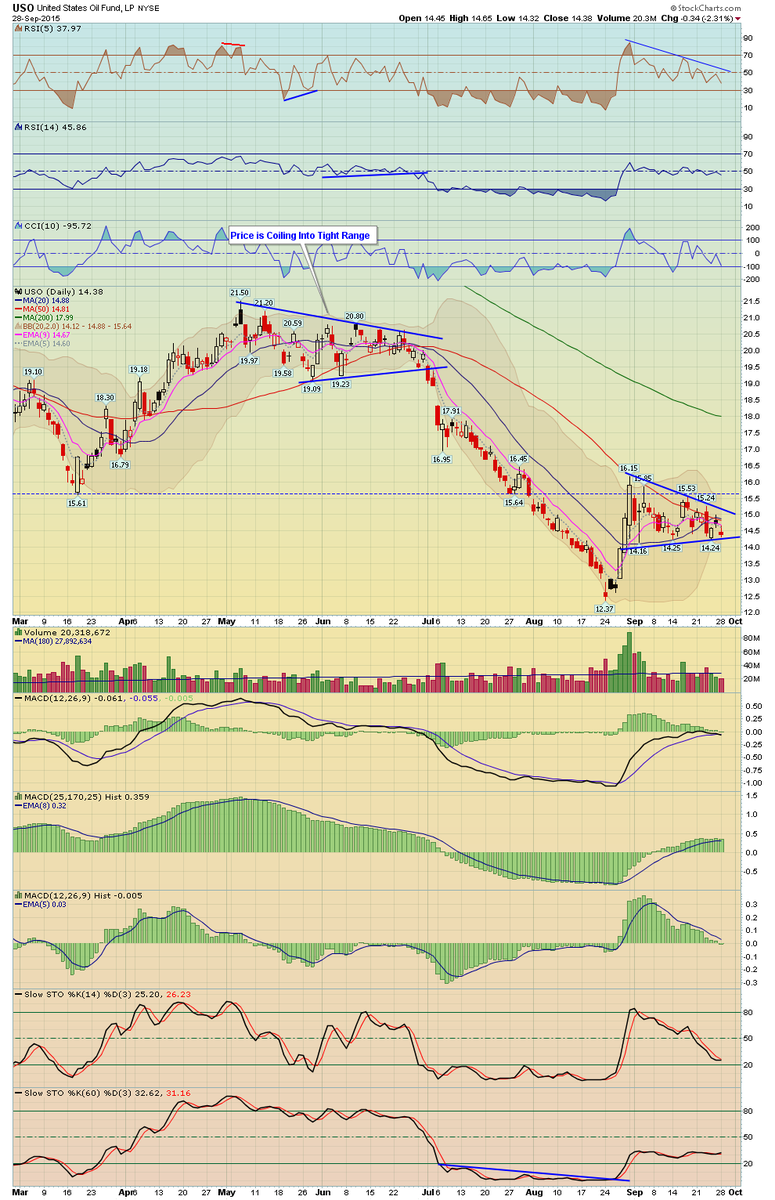
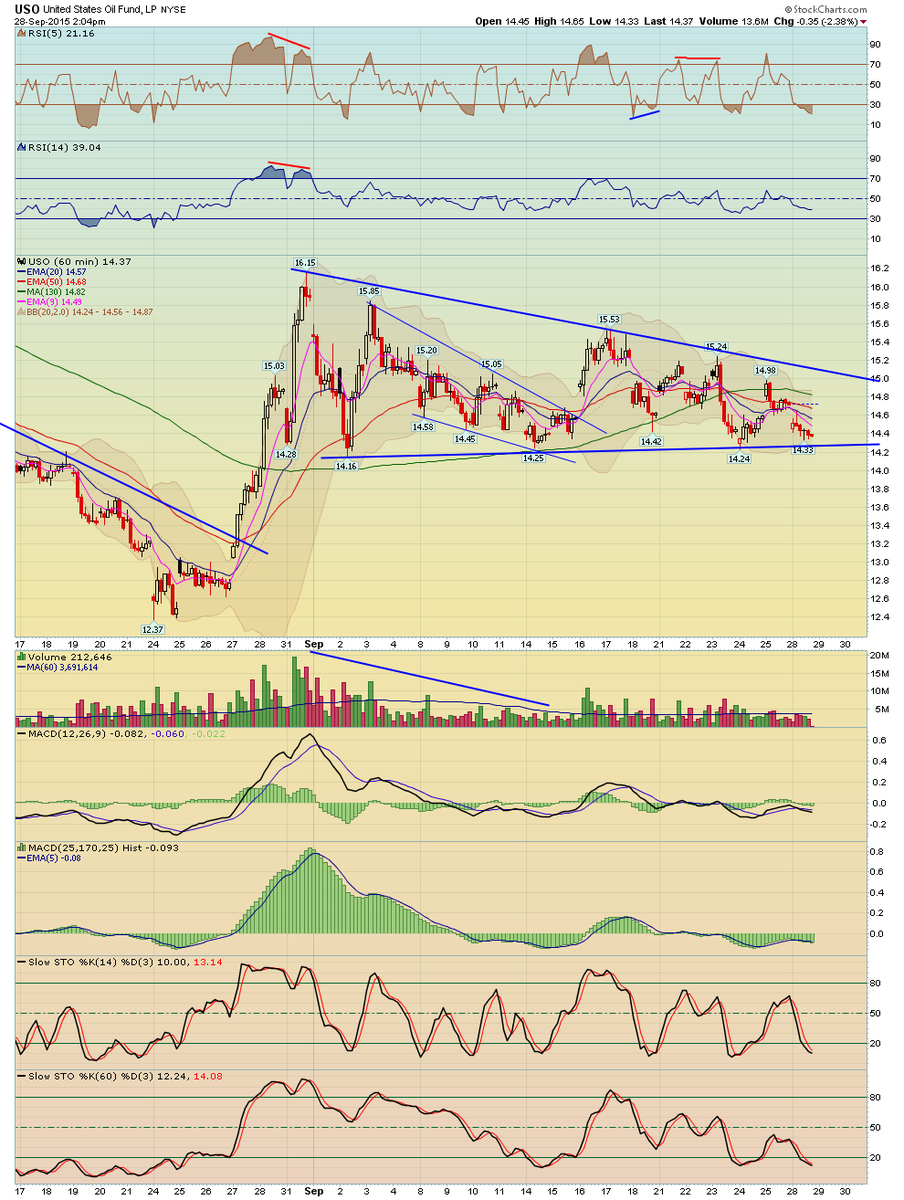
- USO crude ETF, getting tight in this triangle patt...
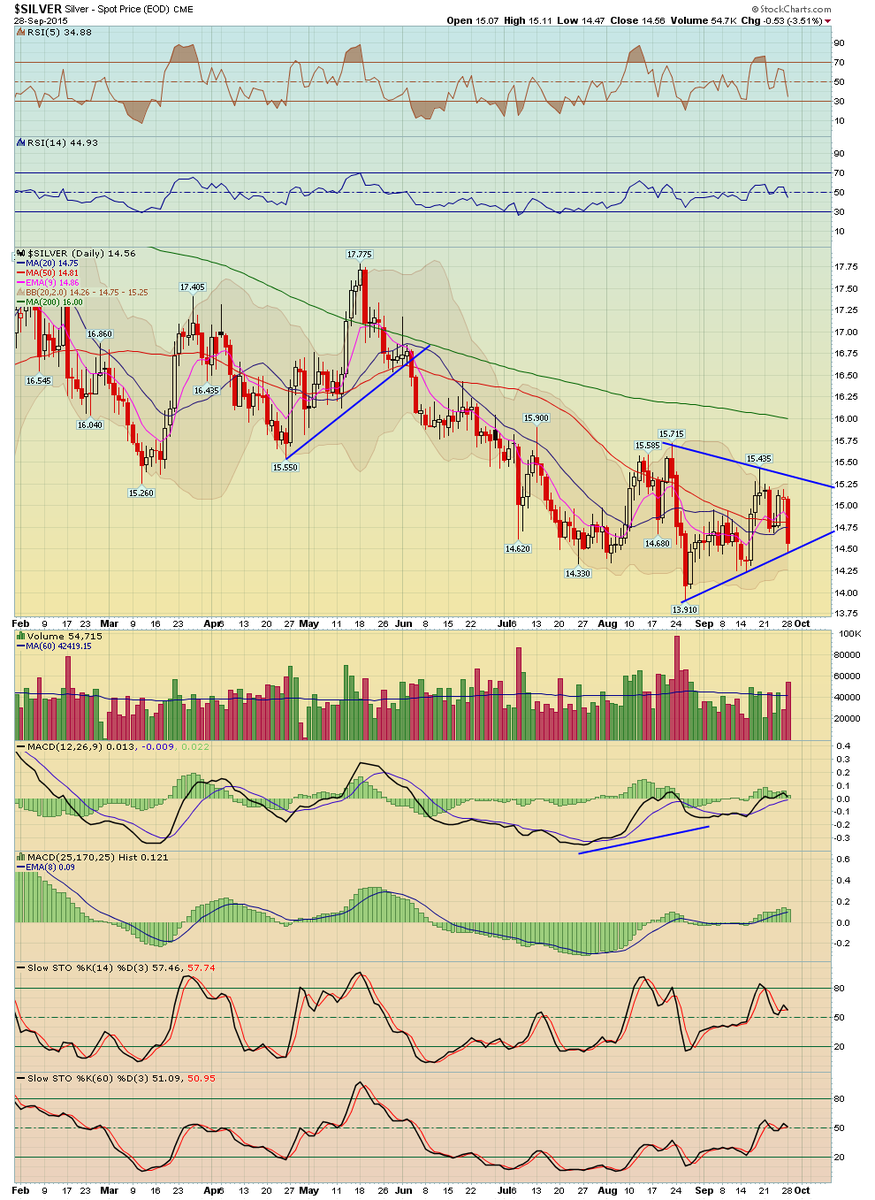
- Daily charts of Silver and Gold, triangle patterns
- Make sure to take some profits on these short idea...
- ABX daily look, gold stocks down today as well but...
- SPX daily with pivots, 1910 pivot range and down s...
- Crude Oil Daily and USO ETF 60 min, still in the p...
- Russell 2000 day index, the first major cash index...
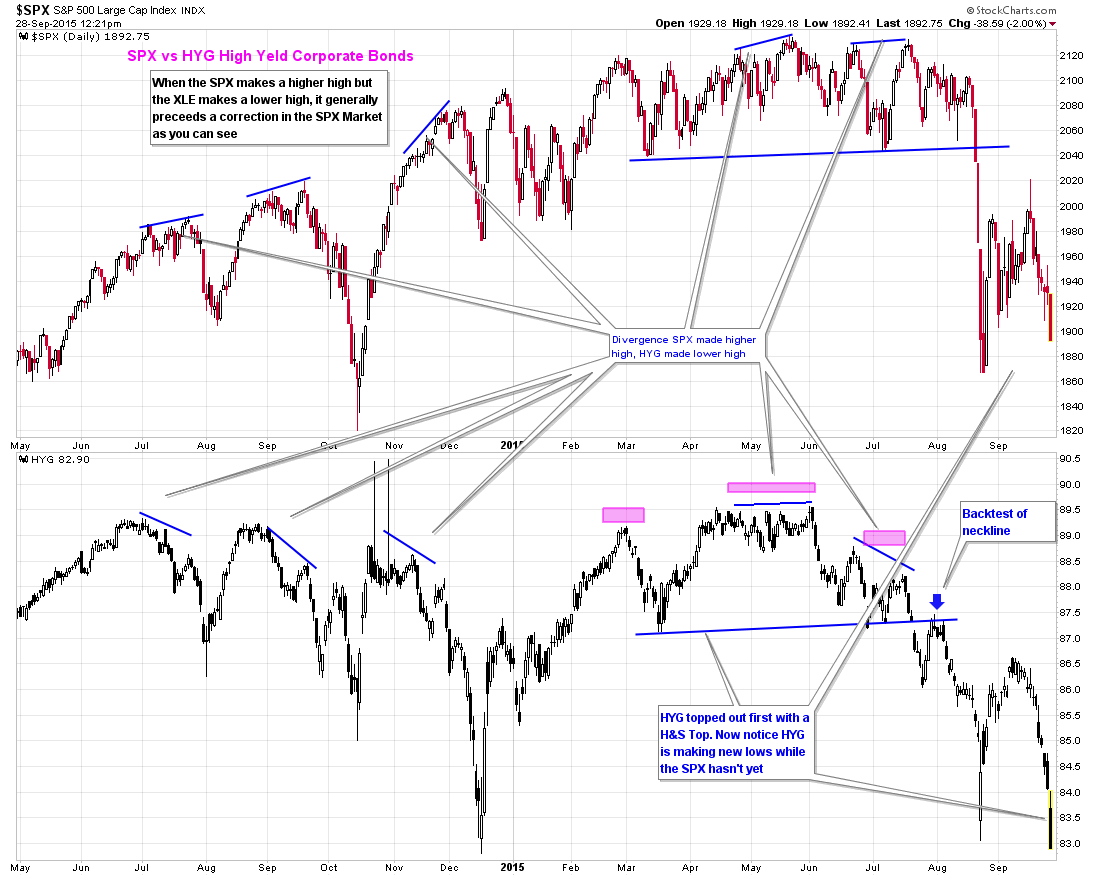
- HYG High Yield Corporate Bonds, has been leading a...
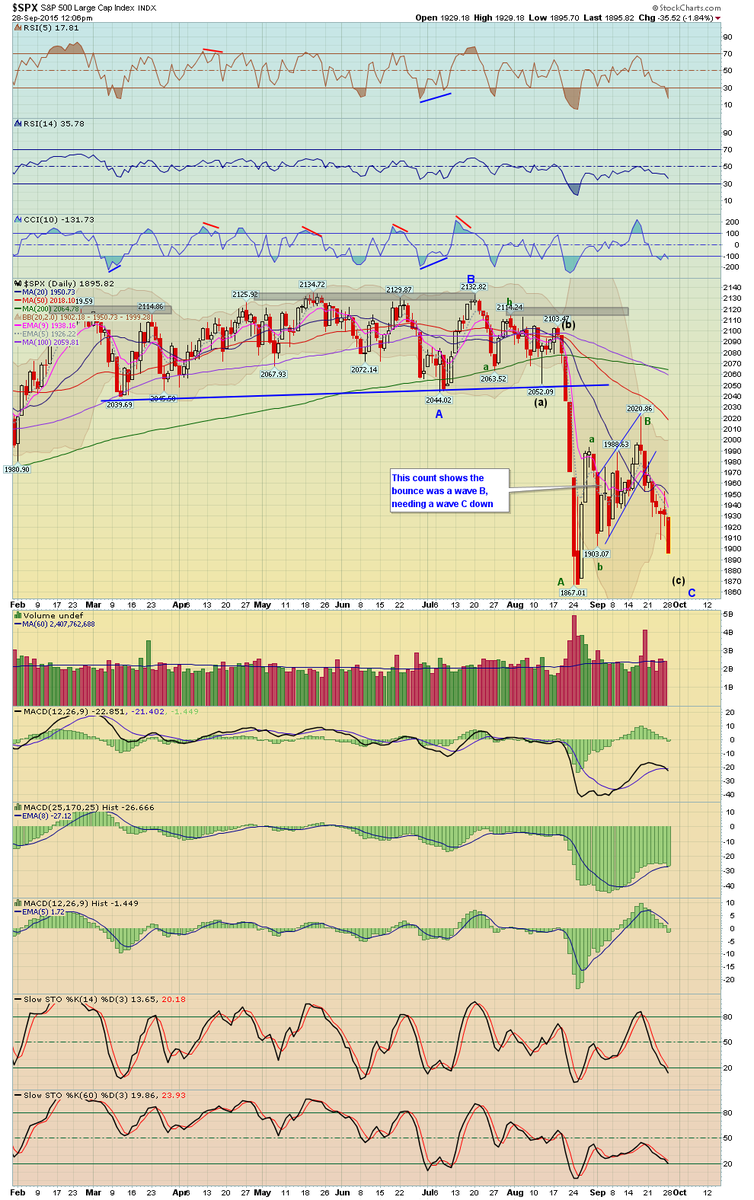
- Daily SPX cash index views, bear flag continues to...
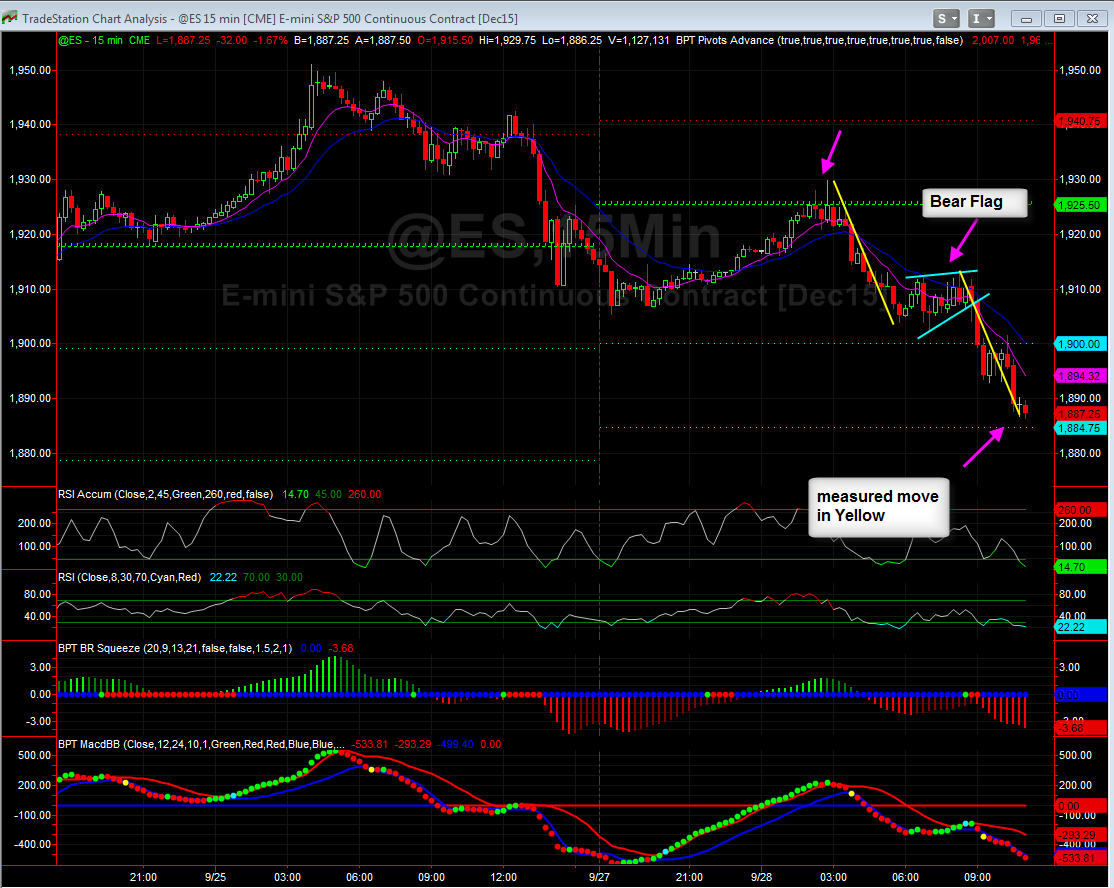
- Updated view of the 15 min ES futures, bear flag h...
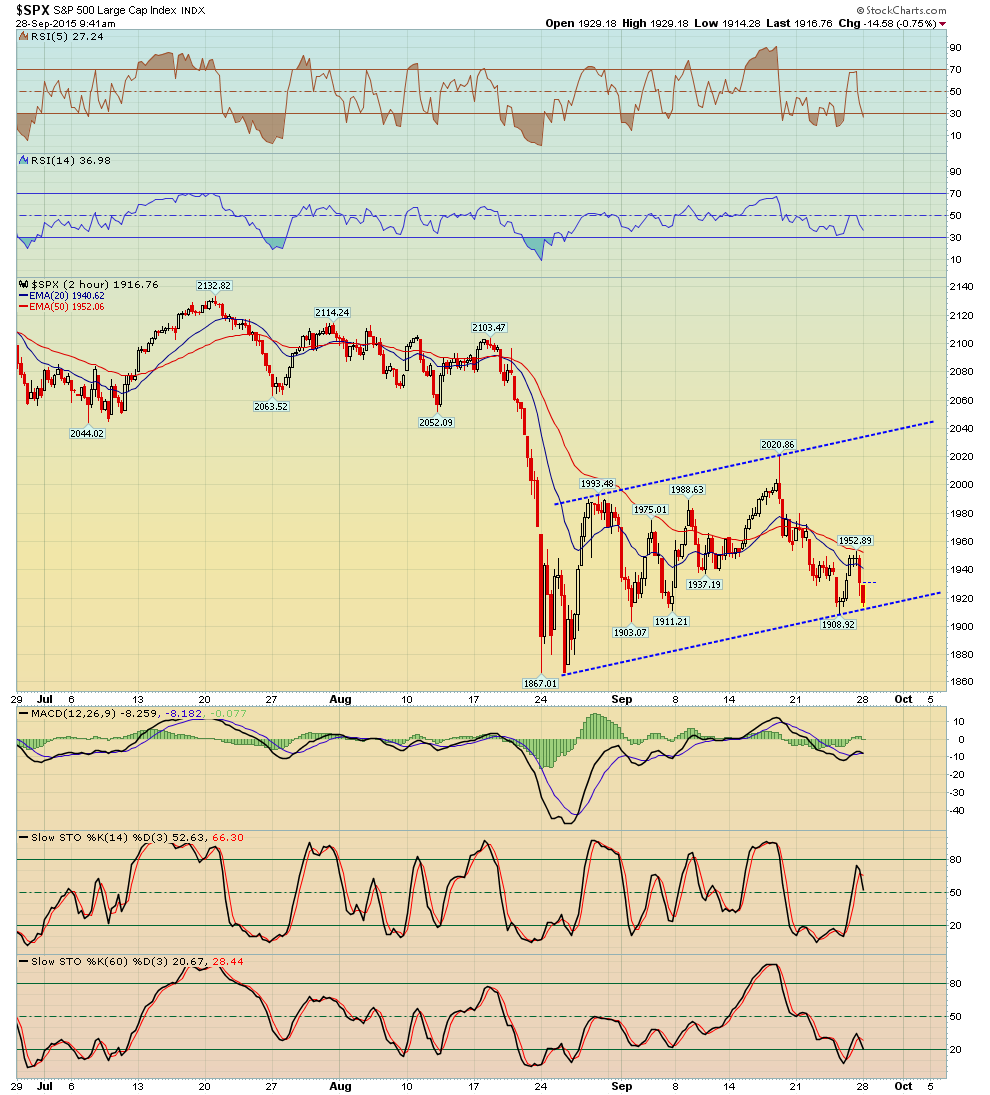
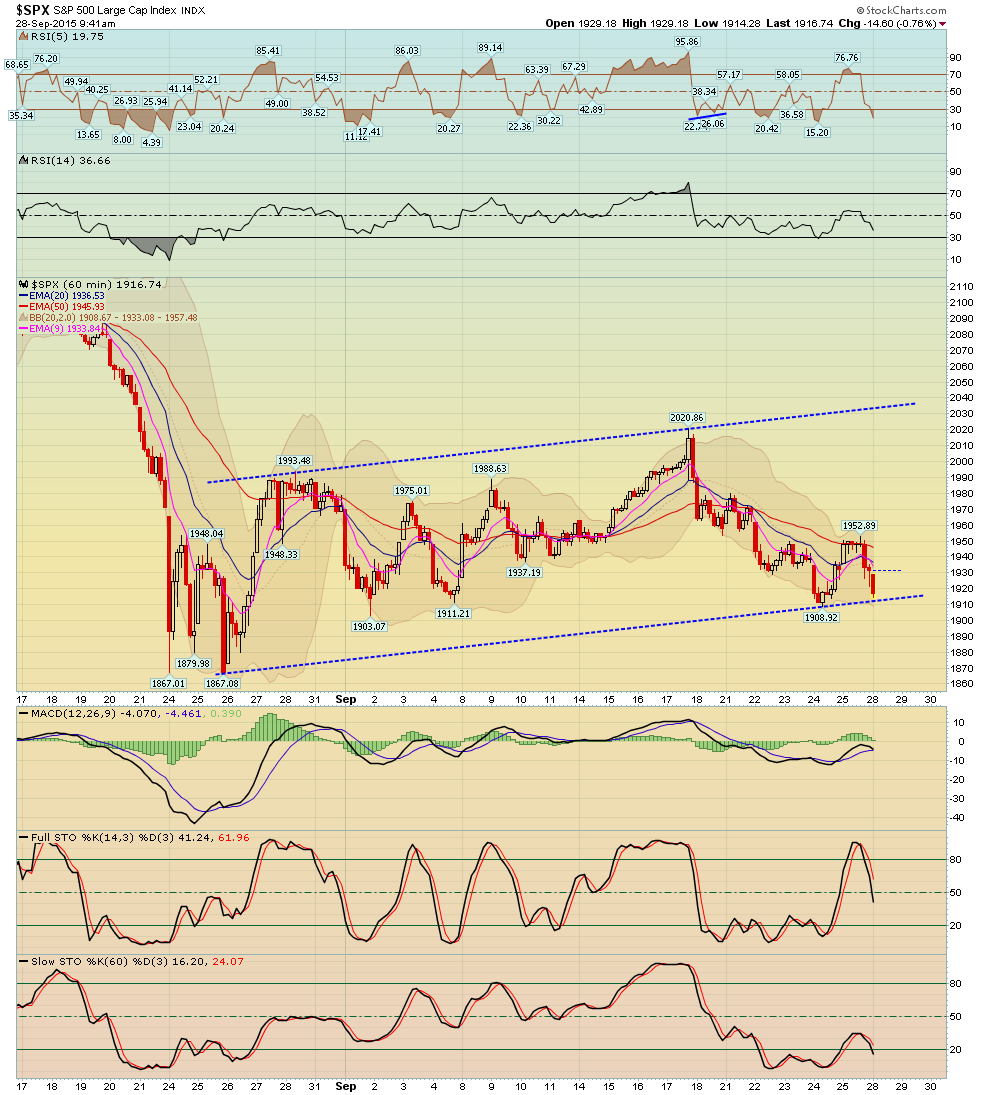
- SPX cash Intraday Views, refer to trendlines
- ES 15 min futures with pivots, coming down to test...
- And here's our General Market Newsletter
- Hello everyone, here's our comprehensive weekend n...
- SPX daily charts, the hammer doji's have provided ...
- RAI follow up to one of the newsletter trade idea ...
- SPX morning highs stopped at the 5 and 9 EMA's, an...
- $USO is the crude oil ETF, exhibits the same patte...
- Crude Oil continues to tighten in this well define...
- I had a ton of charts to post, however easiest for...
- SSYS long idea from a while back, noticed it has a...
- CVT Long Idea, this one still holds up despite the...
- BSQR long idea follow up, posted last night and de...
- POT short idea follow up, was a short idea posted ...
- TAST nice follow through, updated chart to long id...
- Here's a view of the 2011 strong market correction...
- SPX daily chart and a 60 min chart with Fibonacci ...
- Looks like that H&S pattern we showed on ES yester...
- As far as the general market, short term SPX 15 mi...
- BSQR long idea, bull flag pattern, kind of thin, b...
- GSK short idea should it lose the lower support tr...
- AXTA short idea should it lose support here
- BITA long idea, basing pattern, resistance is the ...
- SEM short trade idea, bear flag setting up
- RAI Long Idea, triangle resistance is the upper tr...
- Bull pennant pattern continues to flesh out on Cru...
- TAST Long idea follow up, poked it's head above re...
- Intra day the SPX pulled back and filled the morni...
- Here's an Intra Day ES chart, could the morning bo...
- POT short idea follow up posted this morning, moni...
- IQNT follow up to the flag pattern posted earlier,...
- CBAY Long Idea, what stands out to me about this o...
- CVT Long Idea, breakout play, resistance 33.8, als...
- NPTN Long Idea, resistance 7.71 and 50 day MA
- IQNT Long Idea bull flag setup
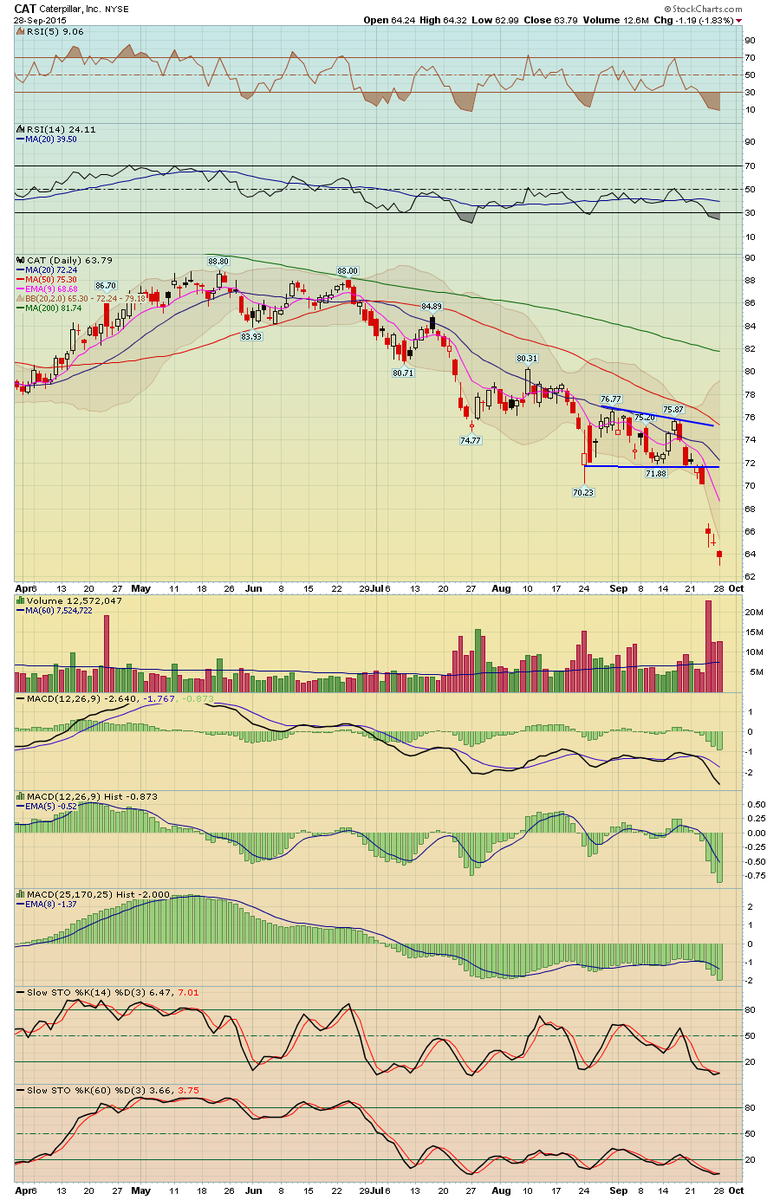
- CAT Short Idea
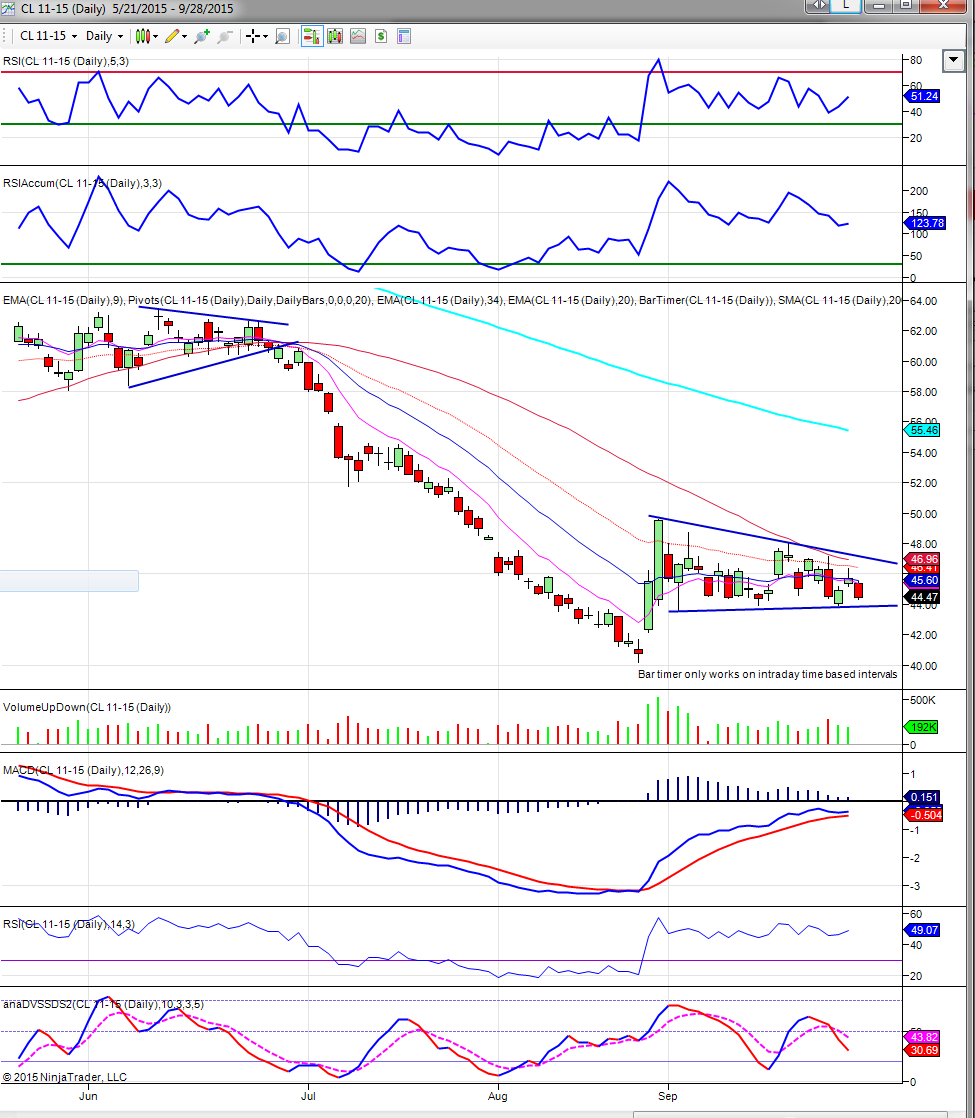
- Crude Oil - very obvious pennant / triangle forming
- BPGDM GDX Mechanical System
- Weekend General Market and Commodity Newsletters- ...
- AAPL Short Trade Idea
- EXEL Trade Idea
- CRMD Trade Idea
- Gold Stocks Follow Through
- GDX Mechanical System Trade
- SPX Objective Short
- GDX/GLD Ratio
- Wednesday, September 16, 2015 Newsletter- Free
-
▼
September
(81)
Wednesday, September 30, 2015
Tuesday, September 29, 2015
Monday, September 28, 2015
Subscribe to:
Comments (Atom)


