Monday, March 12, 2012

Choose Your Own Adventure: SPX 2013

Interesting article for fun from 


Dynamic Hedge


The violent selloff and subsequent grinding higher feels very unique. Some have even said this market feels “unnatural” or “rigged” due to quantitative easing, high frequency trading, LTRO, ZIRP and other boogie men. I assure you these market conditions are not unique at all. Here are 5 examples of statistically similar markets and what transpired afterwards.


These instances were identified by our pattern recognition algorithm as self-similar in form to the market conditions we are currently experiencing. The requirements for this search was a substantial selloff followed with a choppy bottoming process and a grind higher taking out the previous highs. Spoiler alert: These instances (since 1970) overwhelmingly occur in bull markets and tend to lead to meaningfully higher prices.


For reference sake, here’s where we’re at:


Instance 1:


December 1989 – July 1990


The result is quite bearish:


Instance 2:


Actually embedded in instance 1 (freaky): July 1990 – March 1991


The result: Higher prices


Instance 3:


January 1994 – March 1995


The result: Super bull


Instance 4:


February 2005 – July 2005


The result: A pullback and new highs


Instance 5:


April 2010 – November 2010


The result: This instance is fresh in our minds and most will remember a shallow pullback and higher prices.


Instance 6:


The present


To aid your visualization I’ve included the appropriate negative space for both a bullish and bearish outcome.  There is room for both interpretations, but the choice, as always, is up to you.


Bullish:


Bearish:


Friday, March 9, 2012

Regarding Google, it appears to be forming a large H&S ...

Regarding Google, it appears to be forming a large H&S top

Monday, August 22, 2011

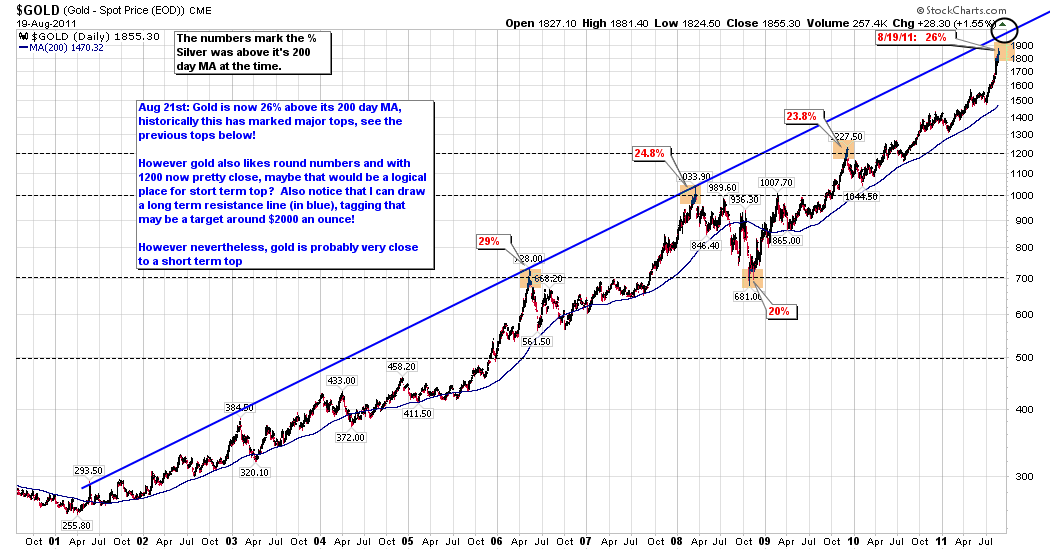
Gold Metal, check out this chart - http://bit.ly/rr0H9R

Gold Metal Comments

$GOLD - 26% above its 200 day MA, which has marketed tops in the past.  However the nice round number of 2000 is mighty close, and there is an upper trendline, so maybe gold tags that area.


Also gold is moving inverse to the market right now as a 'fear' trade, therefore I think once the general market puts in some kind of tradeable bottom, gold will also put in some kind of top.  

Sunday, August 21, 2011

Weekend Commodity Newsletter - http://bit.ly/nVC8G9
General Market Newsletter - http://bit.ly/qU8M06

Monday, August 15, 2011

Commodity Weekend Newsletter Aug 14th 2011 - http://bit.ly/qgHd3E

Sunday, August 14, 2011

Comprehensive Commodity Newsletter - http://bit.ly/lxJ0qU

Tuesday, August 9, 2011

GDX Swing Trade System - http://bit.ly/q3cubc
Gold Weekly - http://bit.ly/mTc6x3

Sunday, August 7, 2011

Renko Charts and their use in Volatile Markets - http://bit.ly/qEY7Hs

Thursday, August 4, 2011

Tonight's newsletter Important Day - http://bit.ly/pkPOvI
Video weekly SPX 500 comments - http://breakpointtrades.com/jing/2011-08-04_0916.swf

Wednesday, August 3, 2011

Video market newsletter Aug 3rd - http://bit.ly/owsJ70

Tuesday, August 2, 2011

Gold Wave Count - http://bit.ly/nZRhMT