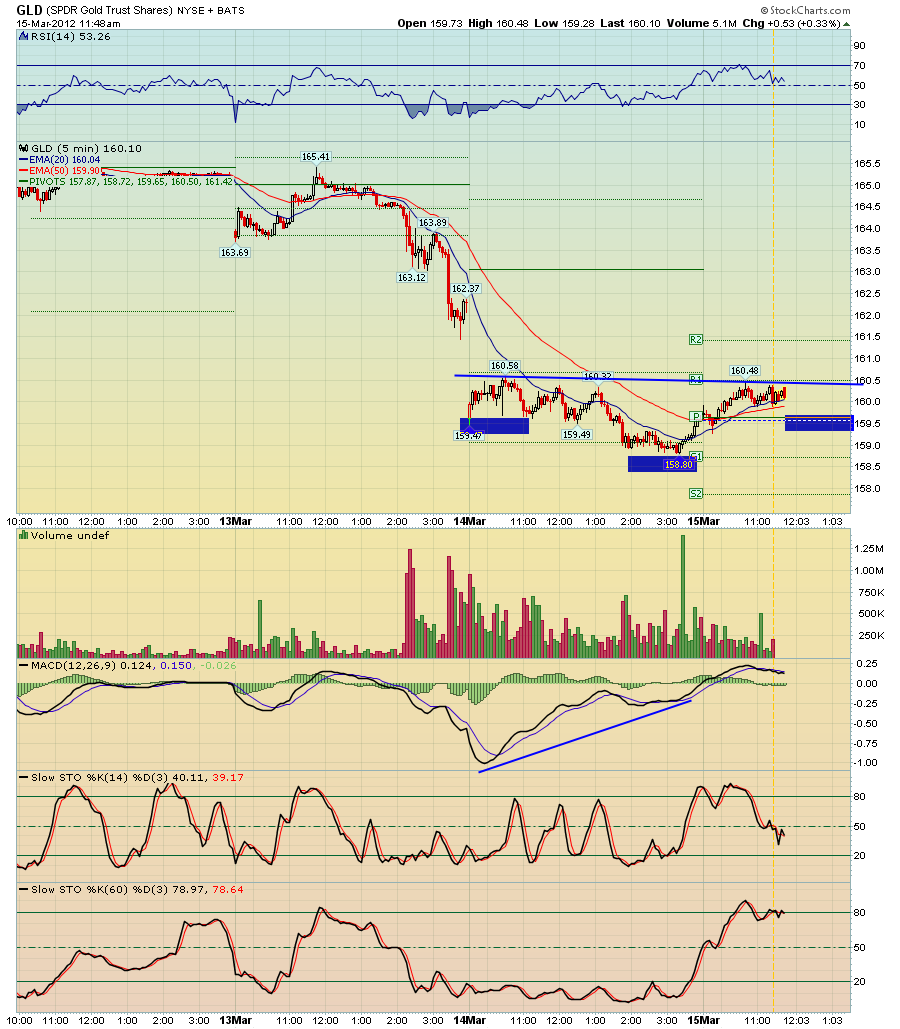
GDX - Zooming out a bit, GDX is once again attempting to find support at the lower trendline, which now has 6 touches

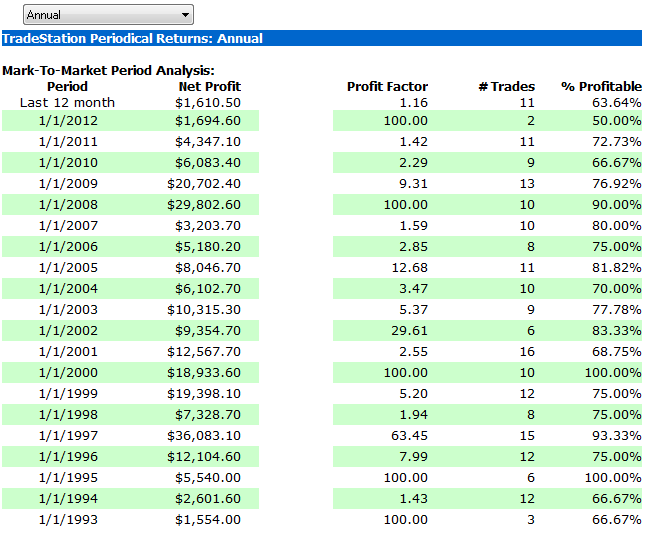
The RSI 2 Strategy triggered today as RSI 2 length fell below 10%. Here's the stats to the system, and the rules
Longs: RSI 2 closes below 10% and price is above the 200 SMA. Exit longs when price closes back over the 9 SMA
Shorts: RSI 2 closes above 90% and price is below the 200 SMA. Exit shorts when price closes back below the 8 SMA
where this system get's caught of course is during market inflection points i.e. a downtrend is starting or an uptrend is beginning



For the GDX weekly, it would be nice to see those stochastics get fully oversold, they are getting close but still not there, matters though what it looks like on Friday's close

yes divergence is building on the 60 min, here's my chart. both stochastics are oversold again so that's good. you need to see MACD cross back up to confirm the divergence. For now GDX is still wedging down. Also watch the GDX/GLD ratio trendline

here's a chart that was sent to me, but I dont' know who the author is, otherwise I'd give credit. Interesting chart, but who knows.
Personally though I do think we'll see a sell in may again this year, though I would not surprise me to see it earlier such as in April sometime, we'll see I guess.

I went a little overboard on the commodity newsletter this week, covers tons of stuff, here you go!
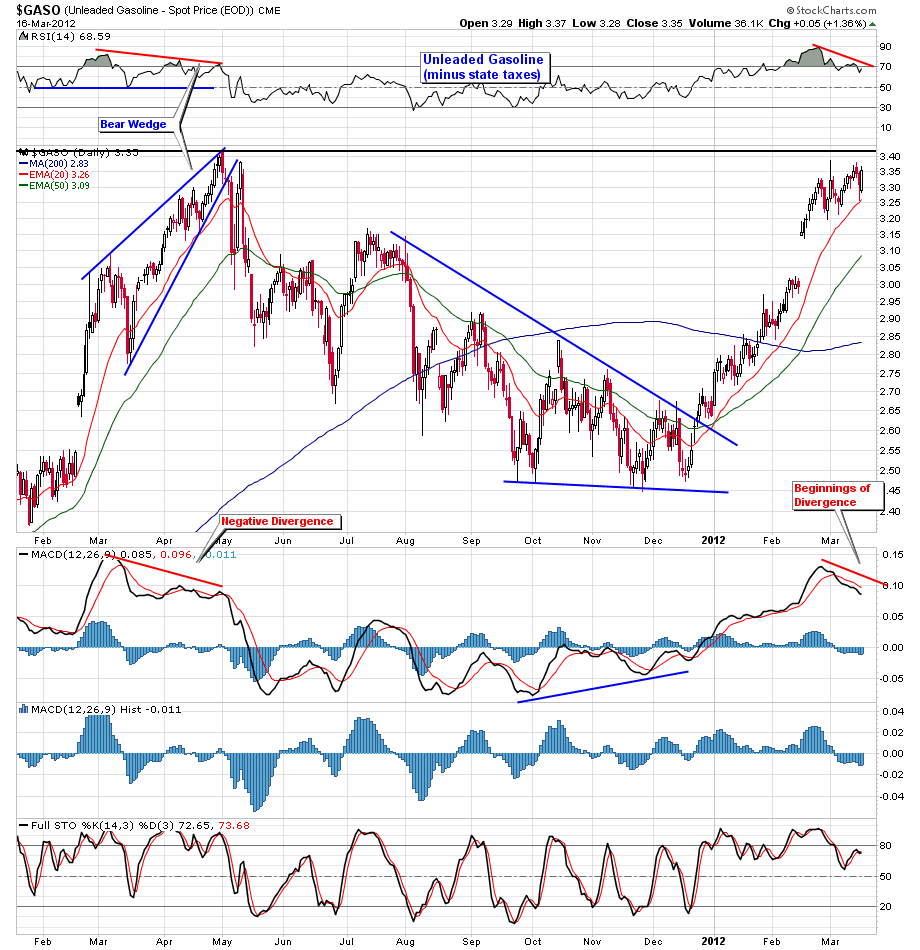
$GASO - Unleaded gasoline (does not include taxes you pay at the pump), some preliminary Neg Divergence forming, however note what happened last Mar, price rallied for another 1 1/2 months to form a longer divergence.
$GASO - weekly view, see the long term trendlines/resistance, breakout out over those would be painful at the pump

USO - 60 min view of USO Crude ETF, the correction has been overlappy and choppy, suggests an eventual upside break
$WTIC - crude daily, the pattern still continues to look bullish, it has consolidated over resistance and now the Ratio is turning up and MACD is above zero.
US Dollar is down 40 cents, so that will help
OIH - Oil Services - interesting pattern to watch, volume has been light


Hello everyone, here's our comprehensive Thursday newsletter covering the general market, Treasuries/Bonds, Copper,Coal,Nat Gas, Gold, and some trade ideas.
Enjoy your Friday and have a great weekend!
Thursday March 15th, 2012 Newsletter!