DIA - bear wedge short idea, see the comments on the chart

TBT - the ultra short 20 year bond ETF, a few weeks ago I stated to watch for a retracement in TBT and to look for support at the lower trendline i.e. look for previous resistance to now act as support on a re-test. Logically TBT rallied nicely off the trendline and provided a low risk long for our members
$TNX 10 year Treasury yield


Click the link below to view the most recent newsletter. This one contains lots of good stuff: market analysis, mechanical systems, precious metals, and great trade ideas
We've all heard of the old Wall Street Mantra, 'Sell In May and Go Away', here's a table of the detailed Statistics.
Click here to watch the video where I describe the statistics in more detail
**please note, if you click on the URL and you get a blank screen, please refresh the page and you should see the video play button.

INWK - here's a long idea that held up well today with decent volume. Resistance is the upper trendline.

AAPL - As you know, the uptrend line AAPL has been astonishing. However it's one to once in regards to the general market, since it represents about a 15% weighting with respect to the Nasdaq 100. Here's a 60 min chart, perhaps a bear wedge is forming inside the uptrend channel, and there is negative divergence; something to watch!

well one thing that has bothered me about gold is that it is typically dead money in the summer usually starting in May, and it's almost April now. One possibility I discussed was for gold to possibly spend the the next 5 months forming a large triangle pattern, it would basically be a choppy up and down mess, then rally in late July or Aug when Gold historically picks up
see my chart, again even if it forms a triangle, it might not be exactly like this, it's an illustration

Click the link below to view the most recent newsletter. This one contains lots of good stuff: market analysis, mechanical systems, precious metals, and great trade ideas
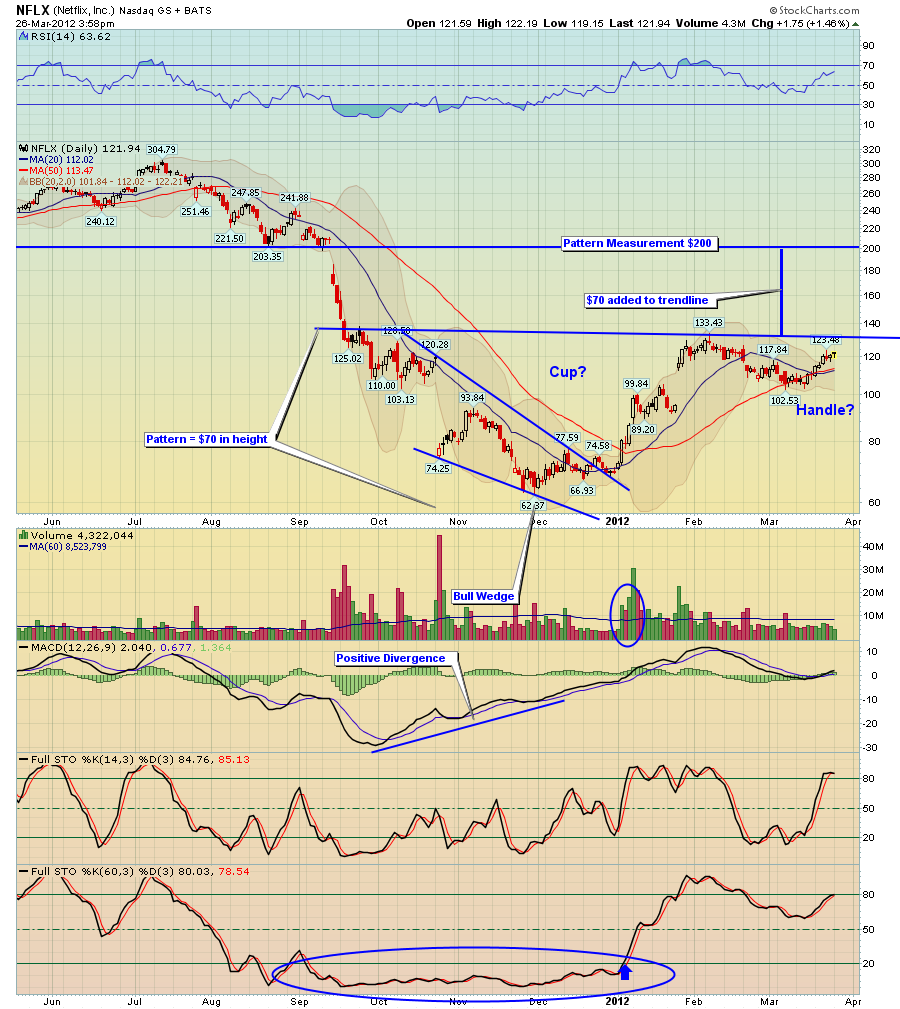
NFLX - a member asked me about NFLX if it could be forming a cup and handle pattern. Yes perhaps, it was an old pick of ours back in Dec which played out well, of course I didn't hold it the 70's to $130, heck of a run
anyway the cup and handle pattern is valid, but you want to see volume pick up on a breakout, if it were to sell down again and take the Mar low or spend too much time going sideways, then it would no longer be this pattern. What troubles me somewhat is the time of the year, we are fast coming up on the sell in May and go away, which actually starts in April if you get a MACD cross via the MACD timing. so will it have time to play out to target about $200 before sell in May hits? IDK.
also it's plotted on a log chart, and is why it looked condensed. the pattern is approximately $70 points in height, so if you add this to the trendline, you get about $200, which also matches up nicely with previous support back in Aug.
who knows,we'll see I guess....
UUP - H&S starting to play out, this is a 60 min chart, however the daily Euro chart as a H&S pattern, so once this short term chart is played out, perhaps the larger one on the Euro will begin to play out


