Friday, June 21, 2013

GDX RSI 2 follow up to questions that I received

Regarding the GDX RSI 2, the system will look to exit the trade whenever the RSI 2 Close is back above 80%, unless my custom momentum indicator turns green, which the system would then hold the trade via until the momentum indicator turned red.


I'm posting this information, because some of you asked me questions and I thought I should post my responce publically. I don't list this as an official mechanical system of the website in the Tradestation systems section of the website, but I had posted it a while back because back in early April when the RSI 2 had closed below 1% on GDX - and at that time I ran my system to find the probability of a bounce.


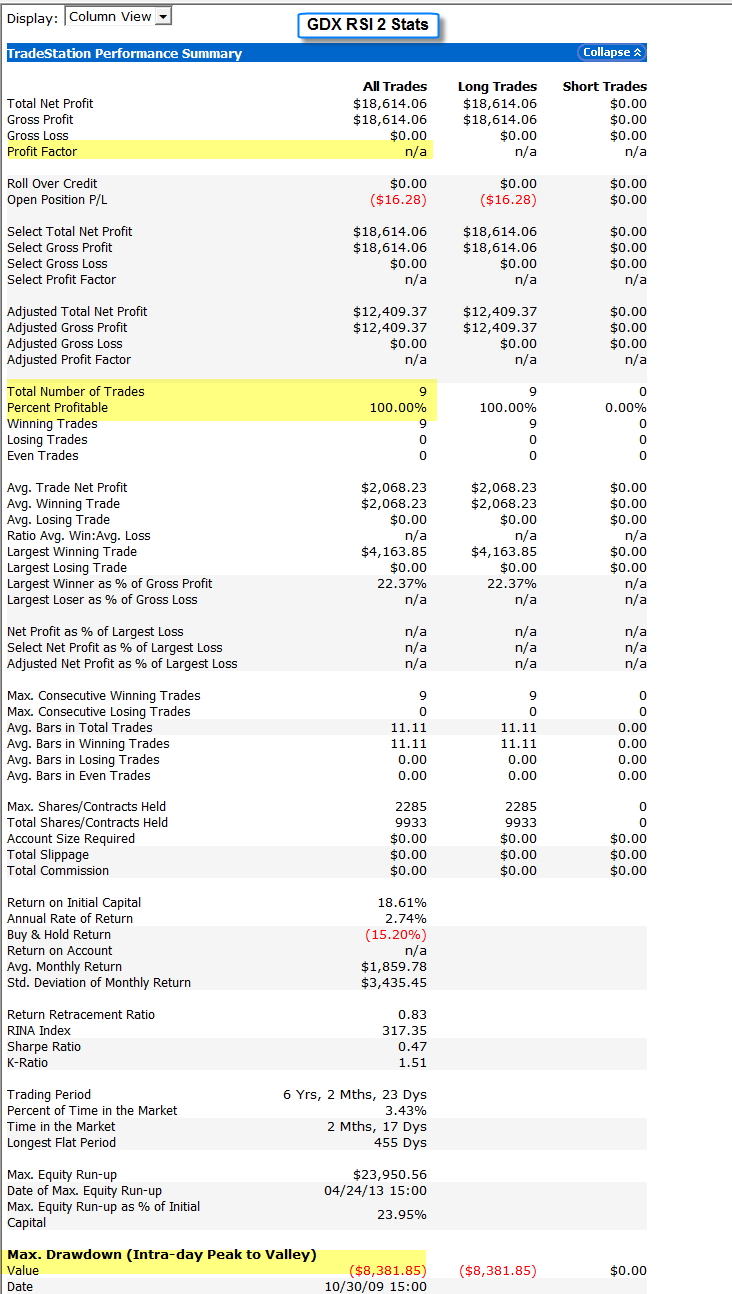
Though as you can see, most of the trades did take some initial heat even though every one of them eventually closed out profitably

Thursday, June 20, 2013

Today was a bloodbath for the market - Let\'s review

Today was a total bloodbath for the market, especially for precious metals.


Here's my comprehensive newsletter review of today's action, please take the time to review because I discuss the daily and also the very short term view of the market, and I also take a look at commodities and some custom powerful indicators that are disposal


**click here** to view the newsletter

SPY system comments and general market discussion

Hello Everyone, as you know if today was an absolute bloodbath for the market. Regarding my previous email on the SPY mechanical systems, the SPY Pro and SPY Ver 2 Systems will not be taken along trade today because one of my filters was hit, that causes the system to look for lower prices.


However, the RSI 2 spy system will be taking an initial long trade at the close of the day of 60% of an initial position, it wouldn't take another 40% at better prices future date if that occurs. I will discuss all this in tonight's newsletter.


CLICK HERE To Watch A Video Overview

GOLD and FUTURES Trading

I noticed a LOT of posts about Gold on the blog. We trade GC futures in the Futures trading room and we don't care if it goes up or down just so long as it moves a specified number of ticks in the same direction. Most trades are less than 90 seconds.


Even though it was straight down (well, almost) today, we had an equal number of long and short trades.


Total Trade signals today were 60 - yeah - a lot of trading, with an even 80% win rate netting you in excess of $2400 per contract.


Those interested in taking advantage of this market regardless of the long term outlook, or better yet, confusion, really should get in touch with Matt or Myself about the futures trading program.

Gold with BPT MA

Below is a daily chart of gold futures, as you know Gold is getting absolutely pummeled today down nearly $100!!  On the chart is my custom BPT MA Deluxe indicator, which as you can see has caught this trend nicely. Remember we also use this indicator on our daily S&P 500 chart

Wednesday, June 19, 2013

SPX views

$SPX - Chart Link - as noted yesterday - stopped at the 61.8% fib


$SPX - Chart Link


$SPX - Chart Link - 15 min view, once it lost those uptrend lines the selling intensified

LEE another winner

LEE was a trade idea in last nights newsletter, I hope some of you caught it!  Yesterday of course AMCC was the big winner


Market Newsletter


**CLICK HERE** To view the Newsletter

Tuesday, June 18, 2013

AMCC wow!

Hear's one of our trade ideas from last night, wow what a move!! and mini of our members caught this one.

Intraday video update and observations on the market, trade ideas etc

Intraday video update and observations on the market, trade ideas etc


*CLICK HERE* to watch the video 


Matt

Monday, June 17, 2013

Video comments on BPT MA DELUXE

as you know it's easier for me to make videos than type a bunch of text


*click here* to watch the video

GDX comments and video

GDX - Chart Link *CLICK HERE* TO watch video


GDX - Chart Link


GDX - Chart Link

AAPL daily chart comments

Could AAPL the forming a complex inverse Head & Shoulders pattern??

remember, the BPT Breadth Thrust indicator what is oversold last ...

remember, the BPT Breadth Thrust indicator what is oversold last Wednesday. Currently the S&P 500 is finding logical resistance at the middle Bollinger Band, which is the same as the 20 day moving average

Sunday, June 16, 2013

Commodity Newsletter

You can view the Newsletter here


hello
everyone and happy Fathers day, here's the weekend commodity
newsletter, this one is a bit longer than normal as I discuss quite a
bit Administration comments.