Sunday, April 12, 2015
Friday, April 10, 2015
Possible VIX Short chart
Possible VIX Short chart
My VIX chart uses 4 indicators in the upper part of the chart to provide Long and Short signals. When the market is above its 200 day line as it is now, a Short signal is generated when all 4 of the indicators are below their lower extreme readings. This means below 10% for the RSI-2, below 30% for RSI-4, -100 for the CCI, and then 20% for the stochastic. Currently the RSI-2 of the SPX, Dow, and NDX are all overbought at more than 95%, while my index of choice the RUT, is at 76+%. If this setup continues thru the close, I will look to scale into a short RUT position and/or a possible long volaitility trade.
In addition to the 4 upper indicators, the %B is near 0.00, the VIX is almost 10% below its 10 day line, and the VIX is also trading below the 20,1.5 Bollinger Band. The combination of these indicators tells me that volatility is oversold and is likely to revert back to its mean.


Thursday, April 9, 2015
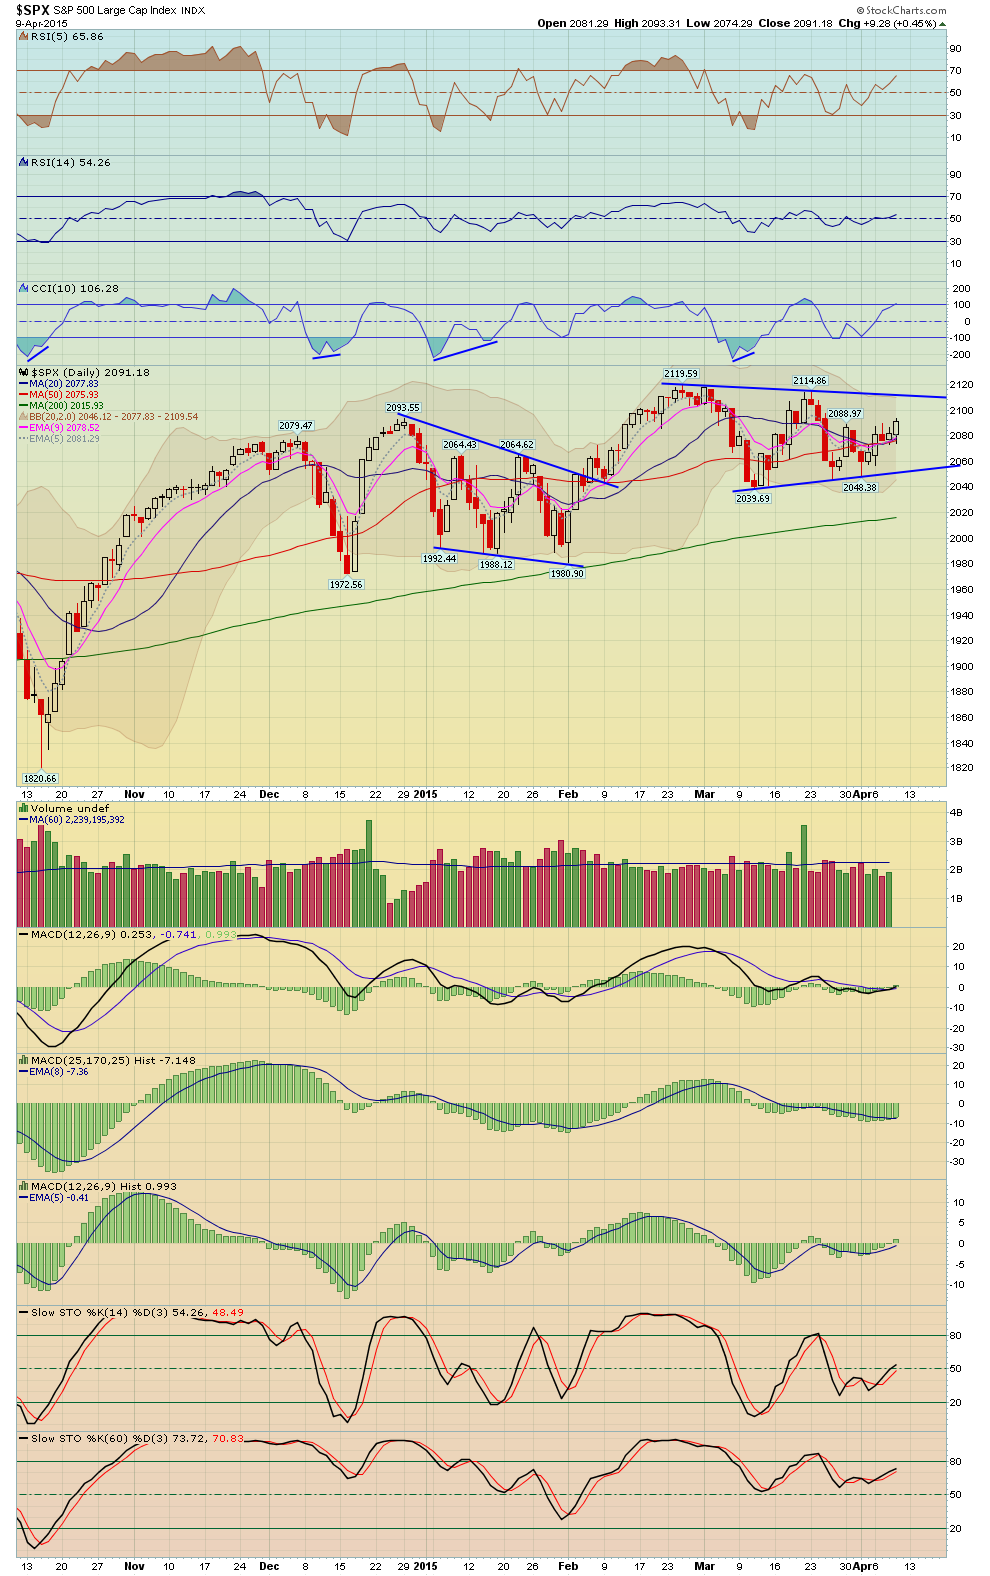
SPX Daily
SPX Daily
Quick comment: When the MA's are flat (sideways) you get more chop which often leads to a coil (tightening pattern) preceding a bigger move.
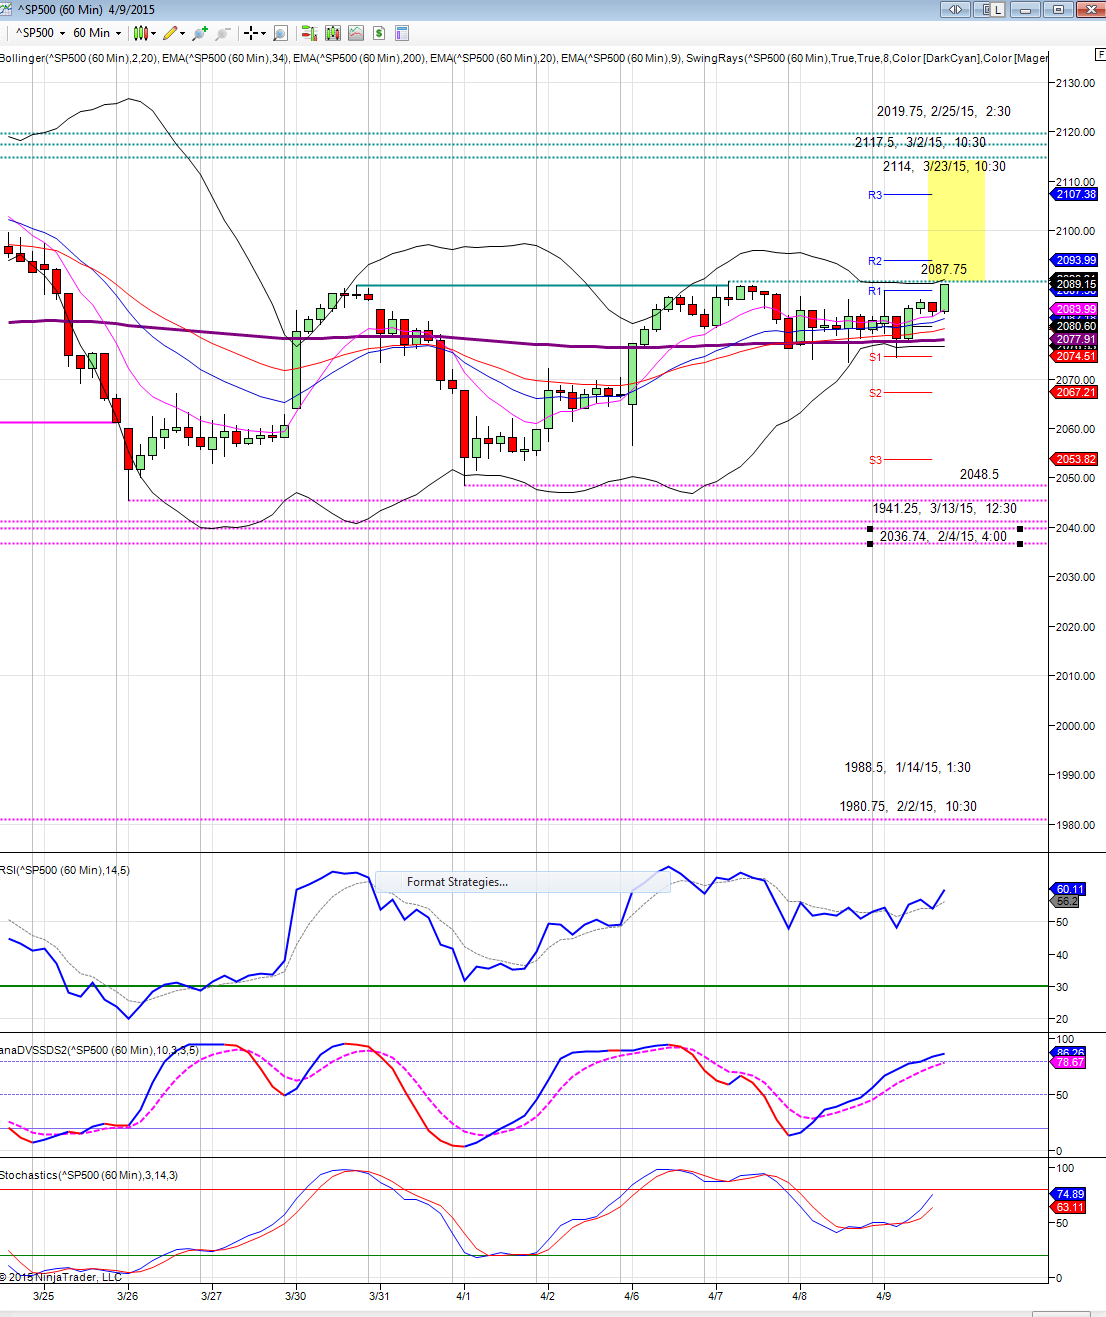
SPX 60 min
SPX 60 min
ninja charts: on SPX we have the resistance from 3/30 just above, now above that there's not much until 2114

"Investor Sentiment More Positive since 1900". � James Paulsen, Wells ...
"Investor Sentiment More Positive since 1900". — James Paulsen, Wells ...
"Investor Sentiment More Positive since 1900". — James Paulsen, Wells Capital Management
May find his Article worth reading
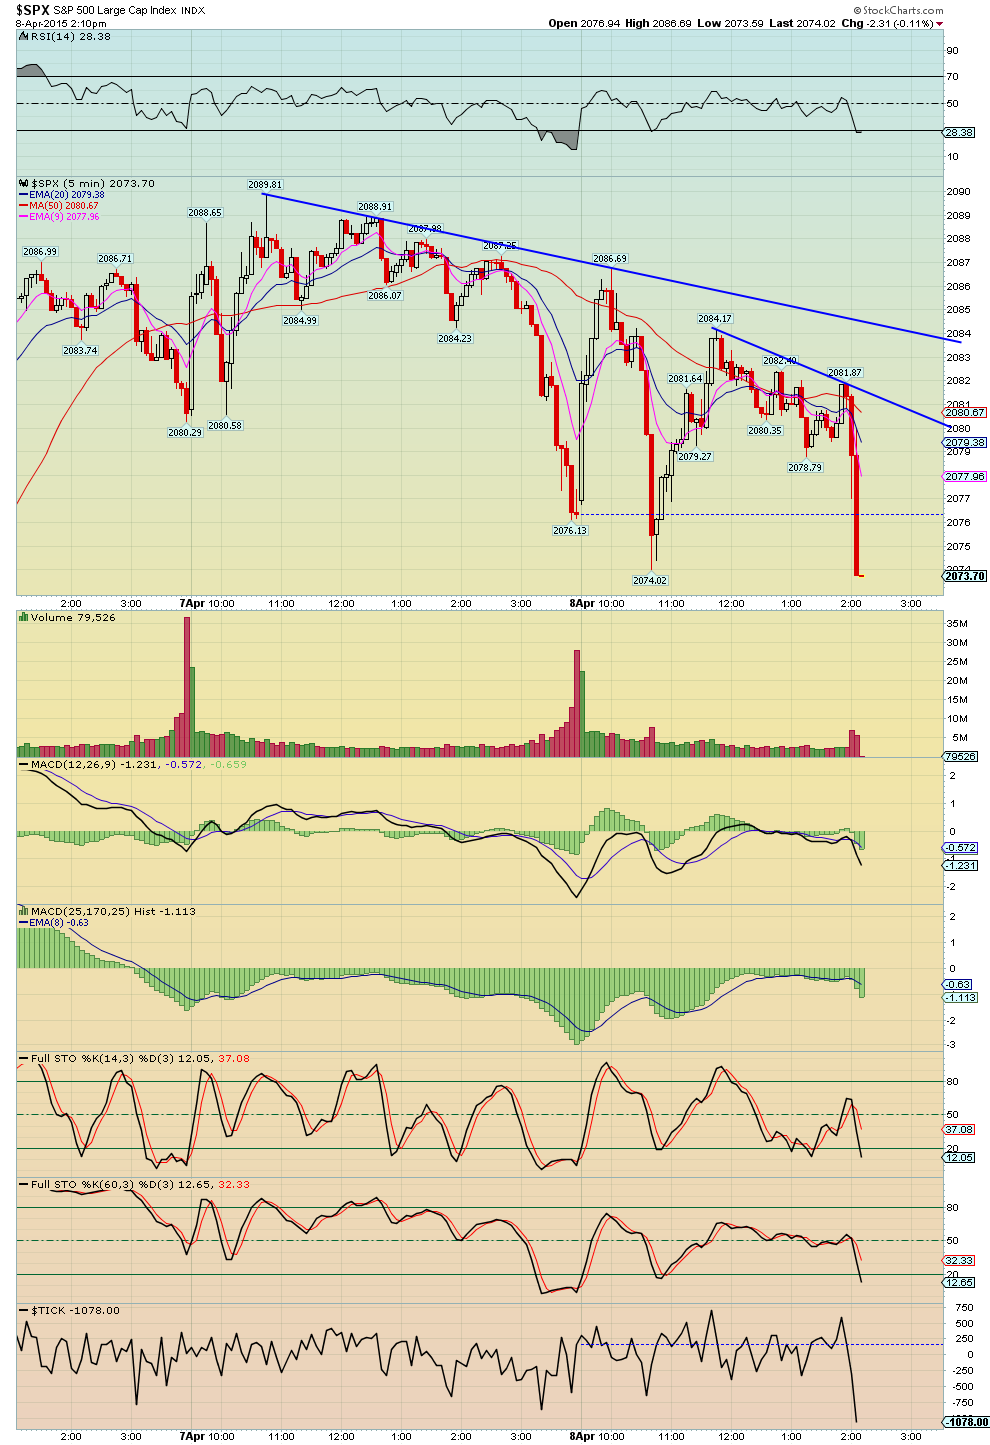
SPX Intraday Views
SPX Intraday Views
Lately, it's been buy the dips and sell the rips in this choppy range.


Wednesday, April 8, 2015


Sunday, April 5, 2015
Weekend Market Newsletters for April 5th, 2015
Hello everyone, first off I hope you enjoyed your nice long weekend and spent some time with friends and family on Easter Sunday!
Anyway here's my highly detailed weekend newsletters, one on the general market and one on commodities. I think they are quite good so hopefully you take the time to review them, and they are free.
CLICK HERE to view the General Market Newsletter
CLICK HERE to view the Commodity Newsletter
enjoy the rest of your Sunday!
Matthew Frailey
SPX Roadmap
Here is a roadmap for those who track OEW...my advice is to not get consumed with prognostications but to respect your signals and the market's action. We will continue to provide updates along the way. For now, the bulls have failed to generate an impulsive rally since the 2039.69 lows in early March (all three rallies in March have been corrective three wave structures that ended with lower highs). Thus, the onus remains on the bulls to hold key support areas AND follow with a strong impulse rally. Make sure you adhere to stops and have an exit strategy in place in case prices move against you on your swing holdings. The market is once again at a key inflection point intermediate term.
See additional comments on chart for specific support levels, etc.

Thursday, April 2, 2015
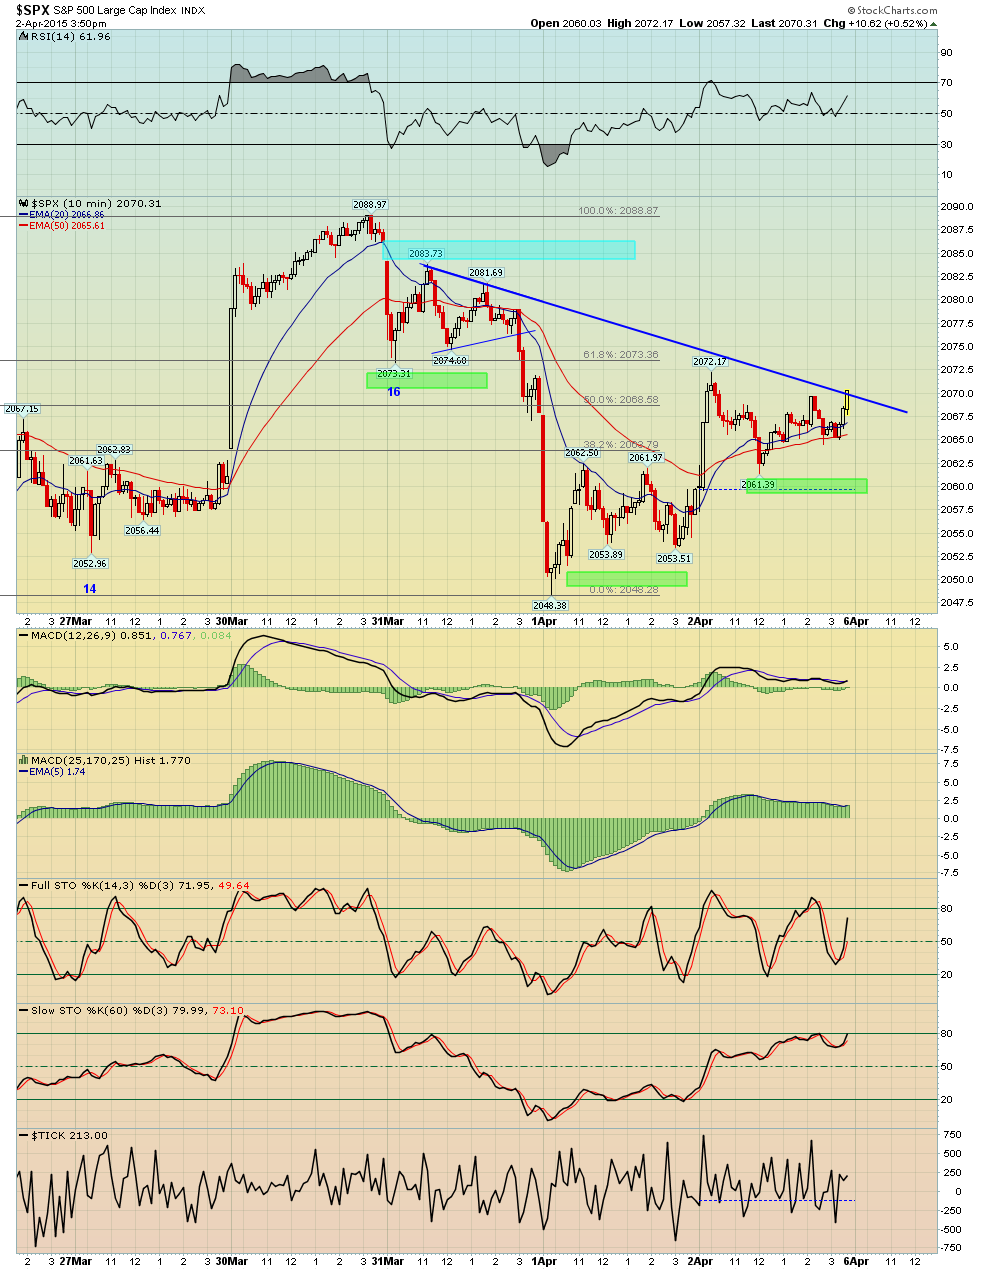
SPX View
Here is the bullish view which will largely depend upon the reaction to the monthly jobs report. Is this going to be yet another short buster? You're call folks.
The target on a confirmed breakout would be 2082 (.618) or 2089.
Again, it's one view to monitor.
Wednesday, April 1, 2015
AAPL follow up
AAPL - Chart Link - daily - monitor the direction it breaks,
AAPL - Chart Link - 60 min view, one could argue a slanted H&S perhaps, again monitor the direction it breaks

