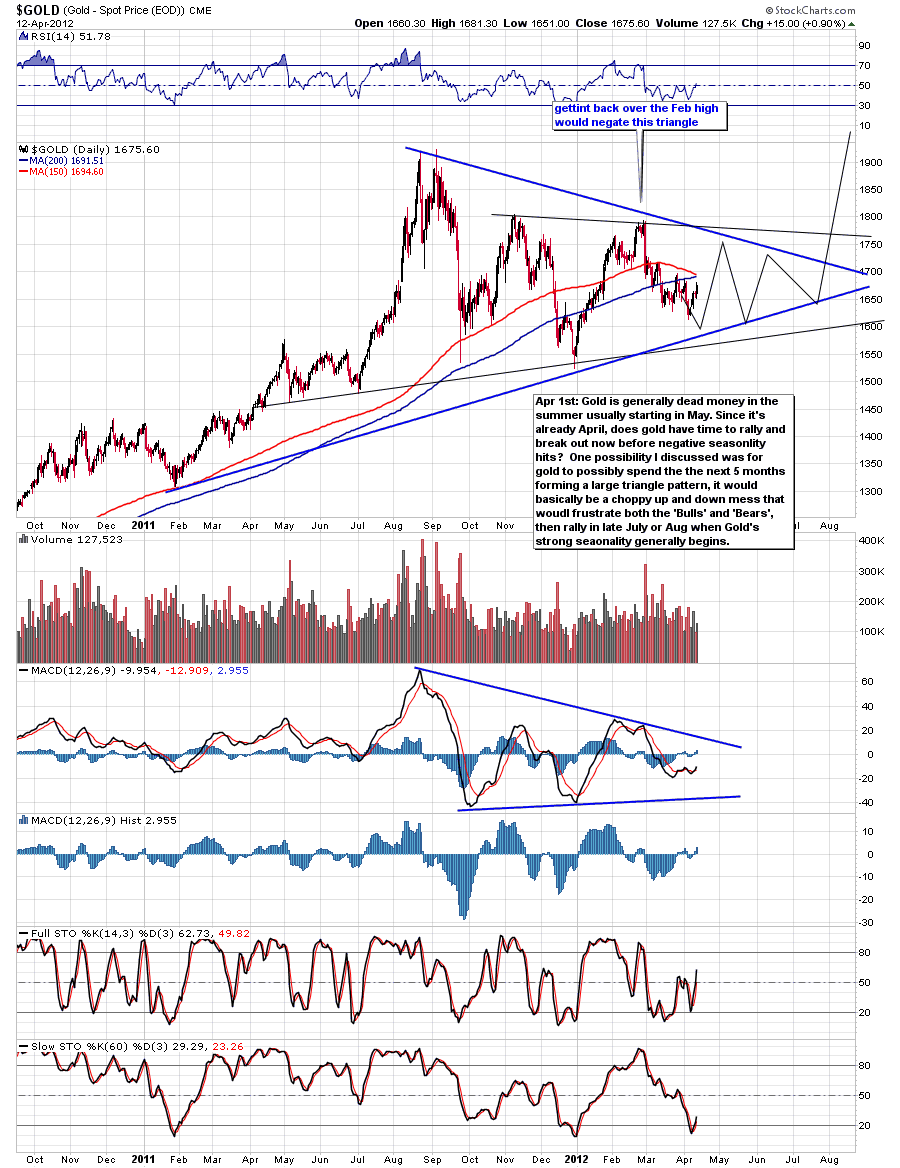
$GOLD - Here\'s the daily chart of gold that I\'ve been showing for a while, as you can see it bounced logically off the long tern uptrend line from the 2008 lows. For now this triangle pattern is valid. Also take a look at the 60 length Stochastic indicator at the bottom, notice how it got oversold recently; notice how that has been a great guide for buying dips.
$GOLD - otherwise here\'s another view that I could see playing out: it shows gold basically forming a large symmetrical triangle pattern for the next 3 - 4 months into late summer and then breakout out in late July or Aug. The reason why this might make sense is because gold his historically weak during the summer months starting from May, therefore it\'s difficult for me to imagine gold having a sustained rally to new highs at this time, therefore I think gold might be due for a lot of up and down sideways choppy action over the next several months before breaking out and rallying hard in the early fall time frame.

No comments:
Post a Comment