Gold stocks have rallied off their June lows and may have finally put in a decent bottom after being the worst sector in the stock market for a year.
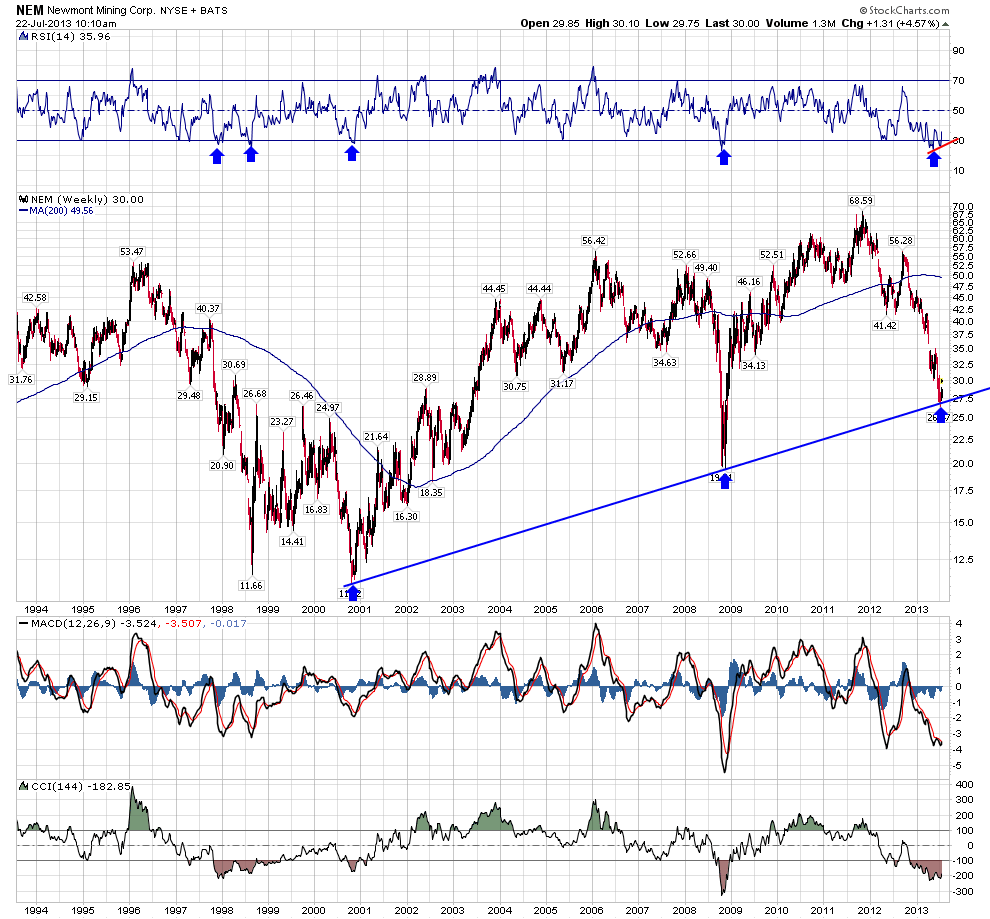
The first chart shows a weekly chart of NEM, take a look a the RSI indicator at the top, notice how over the last 18 years it has rarely been oversold, and on the last low the RSI actually had positive divergence, which was something we haven't seen in 20 years. Also notice the uptrend line from the 2001 lows, NEM is attempting to bounce off this area. Now watch for a MACD cross bullish confirmation, it's now very close. The send chart is another weekly chart while the 3rd is a daily chart showing a well-defined channel.
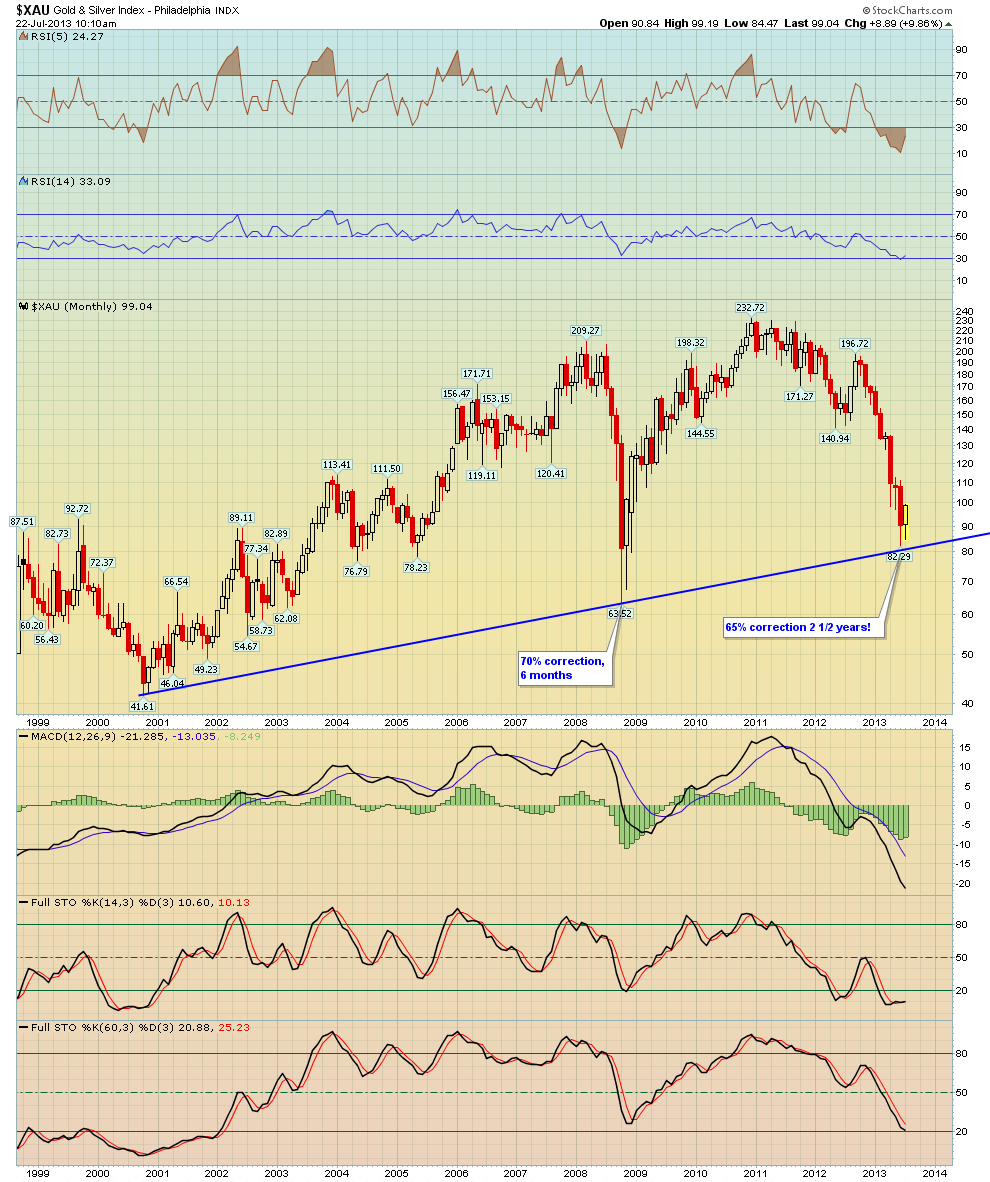
Chart number 4 shows a monthly chart of the XAU index - notice the long term trendline and RSI
Charts number 5 and 6 show weekly charts of the HUI Gold Bugs Index, notice the long term trendlines and RSI indicator. The MACD also has an early bullish cross - the last time this occurred in 2008, the it did not cross back down until 2010


No comments:
Post a Comment