SPX Monthly Chart
SPX monthly chart negative MACD crossover has been joined by a negative TRIX crossover - something that hasn't happened since late 2007. Negative divergence n the RSI-5. A 161.8% move off of the total S&P 2007-2009 decline is SPX 2,138.
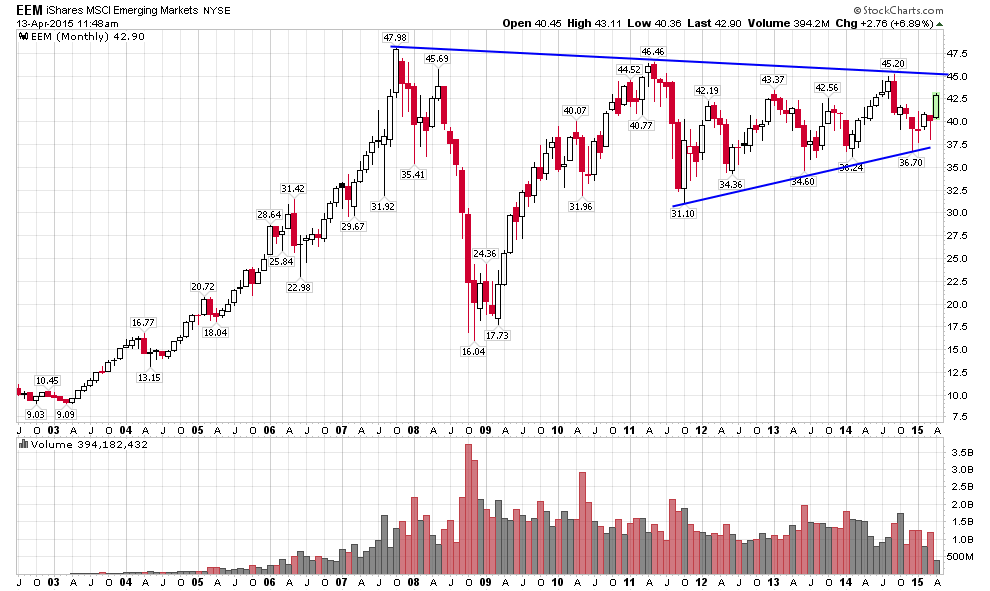
EEM - Monthly
Could be overextended a bit on the daily, but on the monthly, the energy is building ....
No comments:
Post a Comment