thanks to all Veterans!
Monday, November 12, 2012


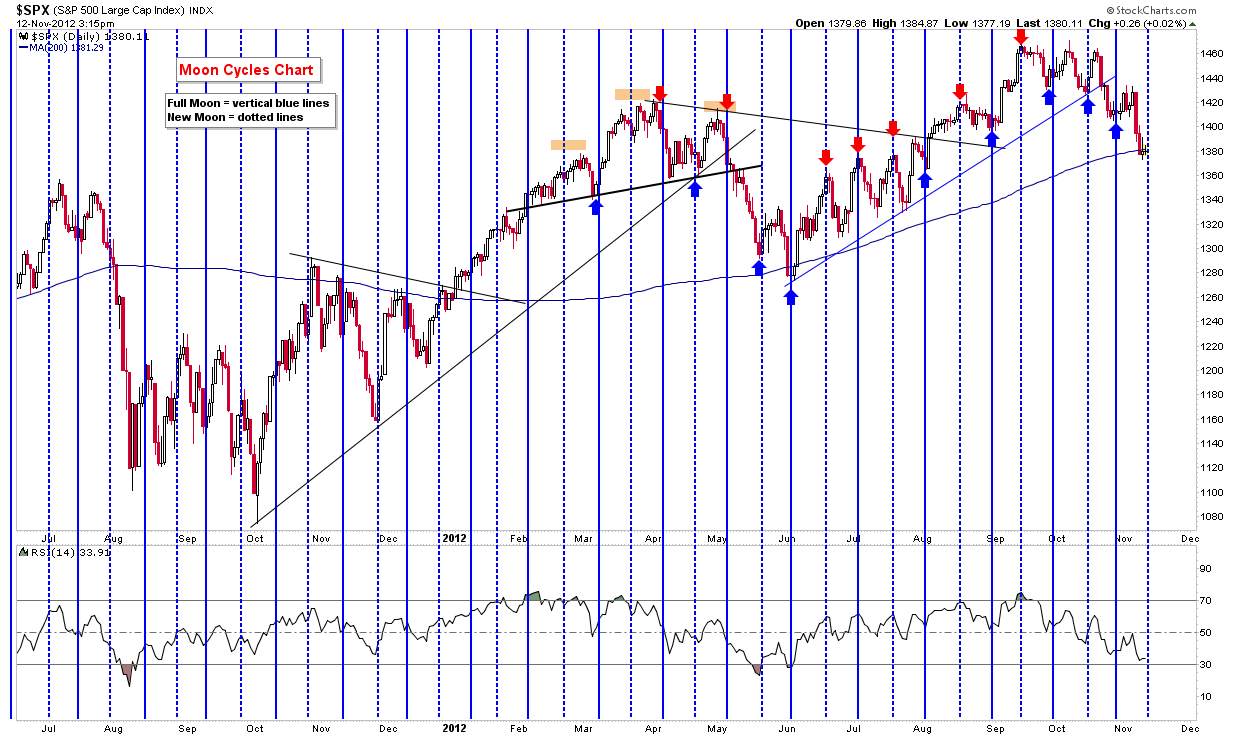
Moon cycle chart
Tomorrow is the New Moon cycle, lately the market has at least responded to the cycles for at least a temporary bottom, we'll see if this one produces a bounce. Remember that the cycles are +/- a day or so
Thursday, November 8, 2012
BPT EMA RSI 2 system comments
The RSI 2 BPT system will go long today if the SPX closes down but remains over the long term 160 SMA. Below the 160 SMA the system doesn't take longs.
If the market closes down today, the EMA based RSI 2 will have been oversold for 2 days in a row, which is a requirement for the system - but again price must stay above the 160 SMA, which is currently at 1386, but can of course change sightly by the close
This system scales in for a potential of 4 entries of 30%, 30%, 20%, 20%, today's entry would be 30% if it occurs.
Remember that there are two versions to this reversion to the mean system, one that closes out when RSI is overbought or oversold, and one trending version that at times will attempt to hold a trade longer when conditions apply. Here are statistic reports for each version of the system
(click below the report will open ONLY in I.E. Internet Explorer as an MHTML performance report file)
Rules: goes long when price is above the 160 SMA when EMA based RSI closes below 11% for 2 days in a row. exits when RSI 2 closes at 80% or higher
Shorts - reverse, when price is below 200 SMA, shorts when RSI 2 closes above 90% for 2 days in a row, exits on a close below 40%
System scales in 4 potential entries of 30%, 30%, 20%, 20%, but each successive entry must be at a better price than the previous one i.e. entry 2 has to be better than entry 1, entry 3 has to be better than entry 2 etc.
This is a reversion to the mean system as it is only in the market 12.4% of the time
(click below the report will open ONLY in I.E. Internet Explorer as an MHTML performance report file)
EMA RSI 2 system - trending certain times
Rules: The same as the non trending system, except this system will attempt to hold trades longer at certain times - however this is still a reversion to the mean system, it's only in the market 19% of the time, the rest of the time is in cash - while the non trending system above is in the market only 12.36% of the time.
As always this is provided as information only, trade according to your plan and risk tolerance

Wednesday, November 7, 2012
Our Recent Newsletter
Hello everyone, here's my most recent Newsletter, please take the time to review as I discuss both the short term and longer term picture of the market, as well as commodities.
Also on an Administrative note, be aware that we have a 'new' Newsletter format where you can skip around and play audio for individual charts vs the whole newsletter (see the tabs at the top of the newsletter.
As always, best to your week!
Matthew Frailey
Tuesday, November 6, 2012
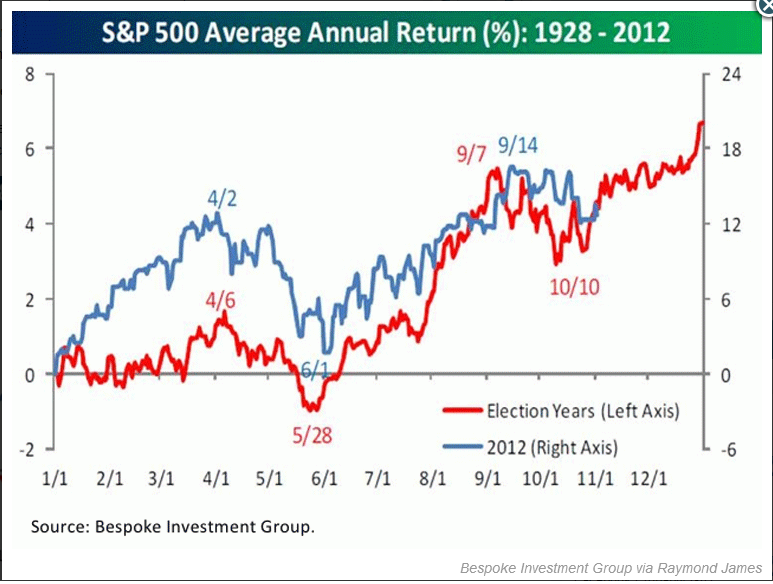
so far the market has tracked the election cycle seasonality ...
so far the market has tracked the election cycle seasonality average this year quite well (average back to 1928), if it continues market should go higher into year end
Monday, November 5, 2012
Here's the updated RSI 2 strategies - As you know, ...
Here's the updated RSI 2 strategies - As you know, one RSI strategy closed out on Thursday (the one that only used the RSI 2 getting over bought without the trending indicator), while the one with the trending indicator closed out on Friday's ugly day after the close.
Here are the charts and Statistic reports. The system that uses the trending indicator has a higher profit factor and a higher net gain, while the one that ONLY uses the RSI 2 to exit trades has a lower profit target of 7 vs 9.8 and a lower total profit gained - however it does have a higher win rate winning 85% of the trades vs 83.9% for the trending system
I will be adding these systems to the Mechanical Systems section of the website and plan to send email alerts when they trigger


Friday, November 2, 2012
futures are up about 7, was up more Regarding the RSI ...
futures are up about 7, was up more
Regarding the RSI 2 SPX system - again do what you feel is right, you can either take nice profits or hold and wait for the system to reverse, or a combination of both. The system won't exit until its trending indicator goes negative, if I turn off the trending indicator the system would be out. The stats are still nice with it off, I've attached two stat reports one with it on and off: the system with the trending indicator turned off actually has a slightly higher winning % of 85.3% vs 83.9%, while the one with the indicator turned on makes more money - again that's only logical
otherwise do what you feel is right and suits your trading style.


Moon cycle chart
$SPX - Chart Link - once again the market bounced at the moon cycle, otherwise today the Jobs report will be released at 8:30 EST, let's see how they spin those numbers

Wednesday, October 31, 2012
APPL charts near support
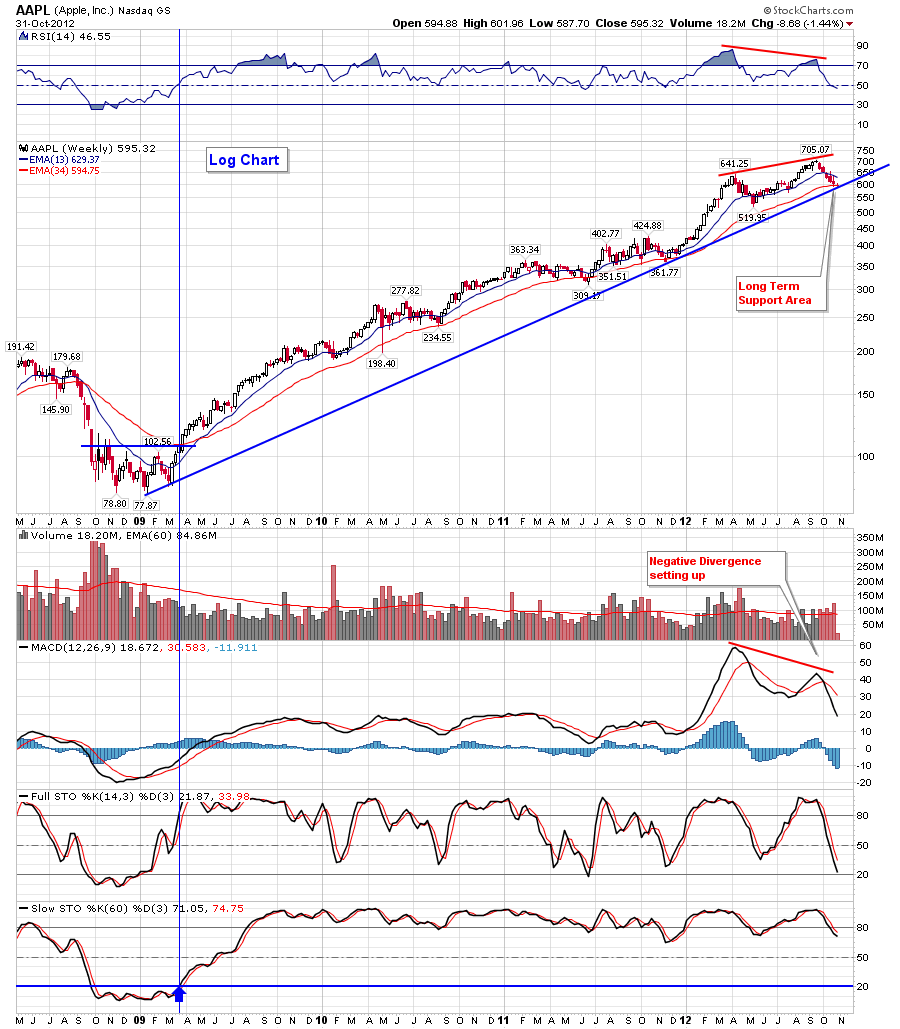
Here's a weekly and a daily chart of AAPL, note that AAPL is near a weekly uptrend line and the 200 day MA is very close.

Sunday, October 28, 2012
There\'s a Moon cycle tomorrow
$SPX - Chart Link - Moon cycle tomorrow, lately the market has been reacting to the moon cycles, will this moon cycle market a temporary bottom??
Otherwise remember the RSI 2 system went long an initial entry of 30% last week. There are a total of 4 entries, the system will scale in to the other trades ONLY on lower prices below the first entry.

Thursday, October 25, 2012
BPT EMA RSI 2 System
Yesterday, 10/24/12, Matt sent out an alert that the BPT EMA RSI 2 System entered an initial 30% long position on the close.
This
notification is to advise that the system will enter in a second long
entry of 30% (bringing the position to a total of 60%) if the S&P
500 closes below yesterday's close of 1408.75.
Wednesday, October 24, 2012
just to show for clarification - 1st entry of 30% ...
just to show for clarification - 1st entry of 30% was taken

BPT EMA RSI 2 system
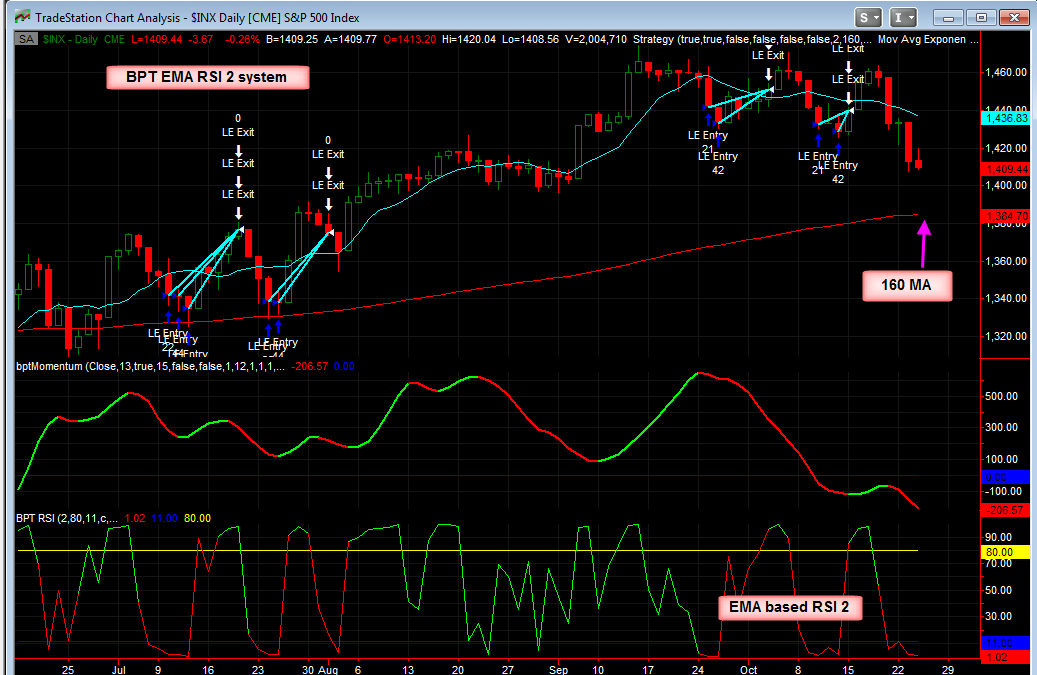
The EMA based RSI 2 system that I discussed before will be taking an initial long position today of 30% if the SPX closes negative or even flat. The system has a total of 4 potential scale ins if better prices are met (30%, 30%, 20%, 20%). Most of the trades end up having 2 entries. Currently the S&P 500 is down 5 points, again the closing price is the key.
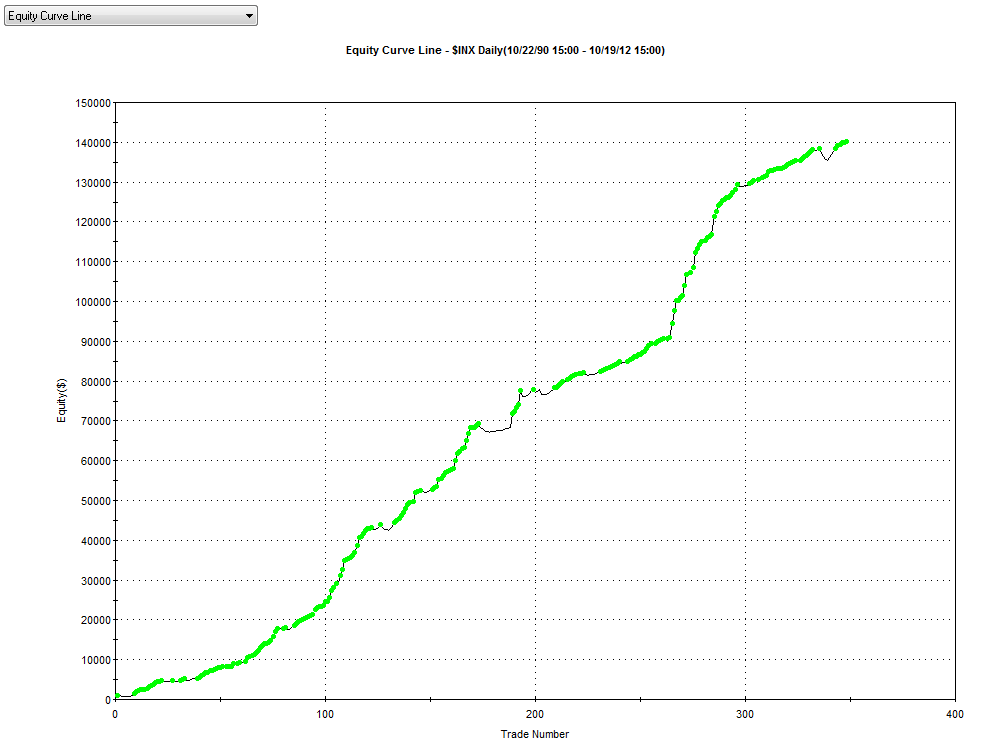
Key statistics - 21 years
349 trades
84% winning trades
Profit factor of 9.9
Average time in trade is about 8 days
**CLick Here** to see a full statistics report including a list of all the trades. NOTE** this must be opened in Internet Explorer ONLY not Chrome or Firefox
-----
Modified RSI 2 system -uses an EMA based RSI 2:
Longs:
When price is above the 160 SMA, go long when the RSI 2 falls below 10% for 2 days in a row.
Exit Long when modified RSI closes back above 80%
Exception (I use a trending indicator to hold trades for longer periods of time under certain conditions).
Shorts:
When price is below the 160 SMA, go short when the RSI 2 closes above 90% for 2 days in a row.
Exit short when modified RSI closes back below 40%.
Exception (I use a trending indicator to hold trades for longer periods of time under certain conditions).
**Note** For all the statistics below, all trades were 100K for simplicity purposes with no compounding. Additionally, this is presented for informational purposes only, do what you feel is right and always use proper money management


Tuesday, October 23, 2012
Subscribe to:
Posts (Atom)