Thursday, January 10, 2013

SPX 60 min

$SPX - Chart Link - nice market move today - again as I stated last night, there was nothing bearish, in fact most of the indexes and sectors looked like bull flags on their daily charts trying to bounce off their 9 EMA's.


Otherwise via the 60 min chart - one thing to watch for now is negative divergence, note this uptrend channel - first off watch to see if the upper trendline of the channel acts as resistance - would offer low risk quick short with a tight stop.  Keep an eye on the MACD, it is lagging, therefore negative divergence could set up but for now it's only a potential and SPX may want to go and test the upper channel trendline.  


Plus as I said last night - SPX is so close to its Sept high, why not at least test it which it's only 2 points from right now

Coffee analysis

$COFFEE - Chart Link - I had a request via a pm from a member to analyze coffee, here you go: the first chart shows a that coffee is getting close to a long term uptrend line from 2001. Some divergence in place via the RSI, MACD needs help - again this is a monthly chart, so it's gonna take a while to play out


$COFFEE - Chart Link - weekly chart, see the downtrend line and divergence


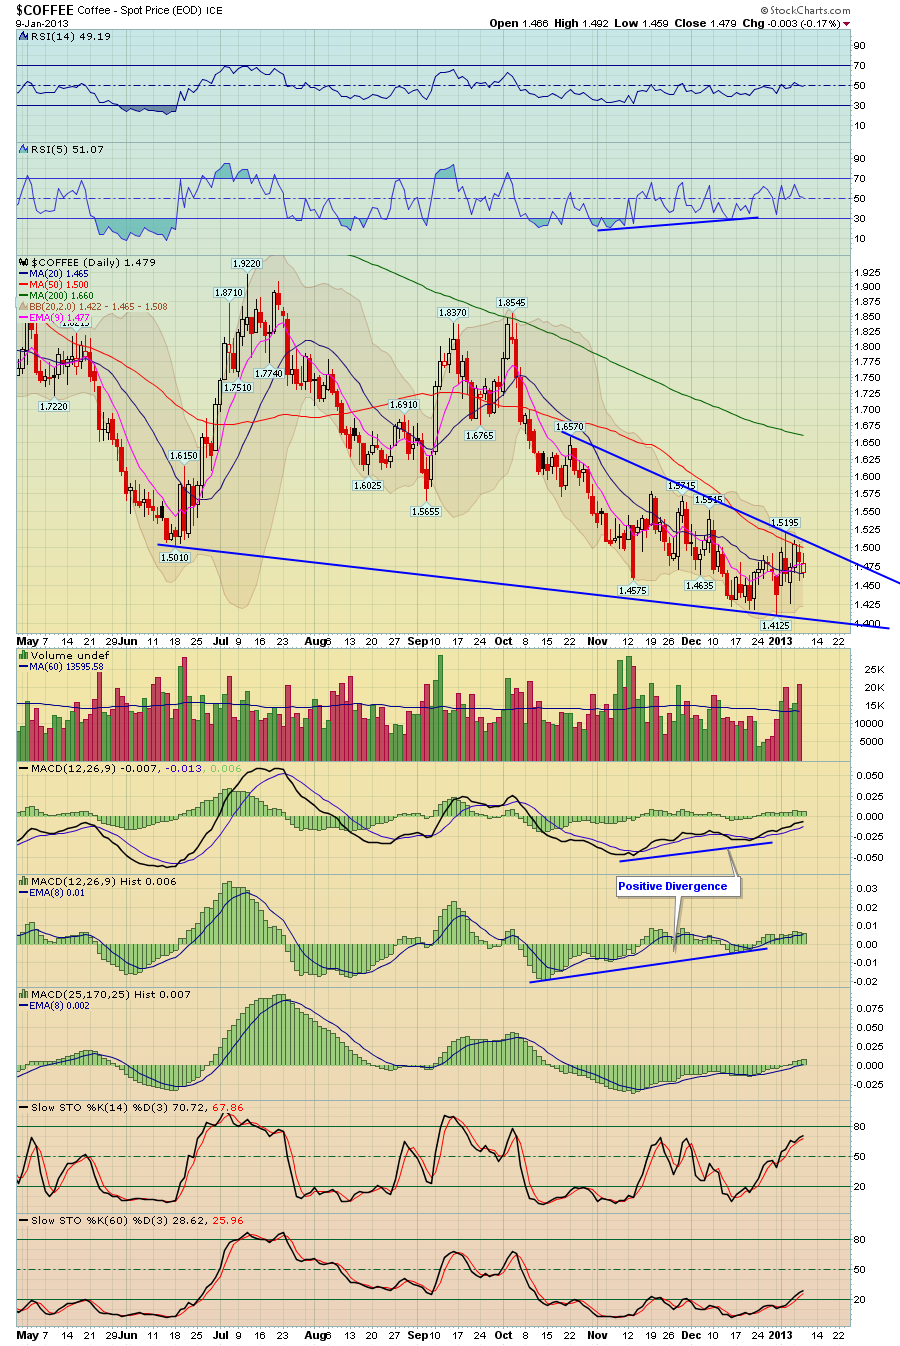
$COFFEE - Chart Link - daily chart

Tuesday, January 8, 2013

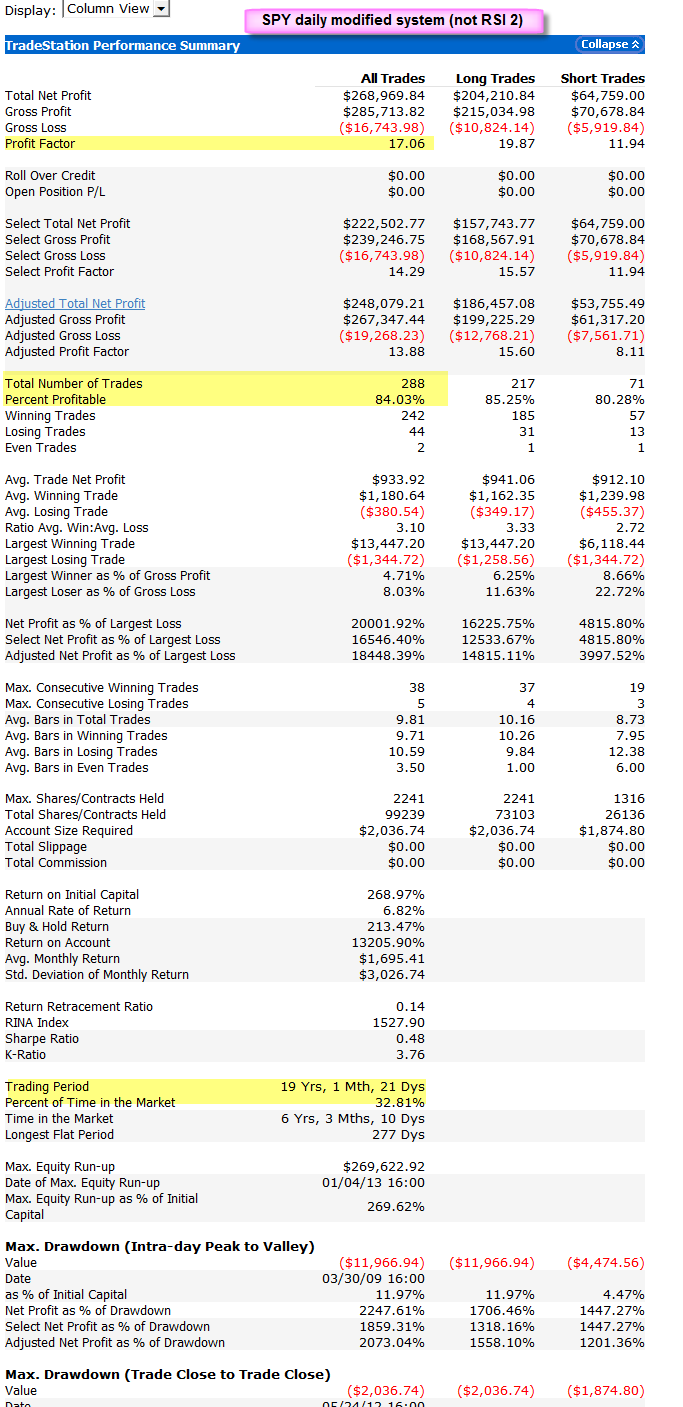
Follow up to the SPY daily modified system

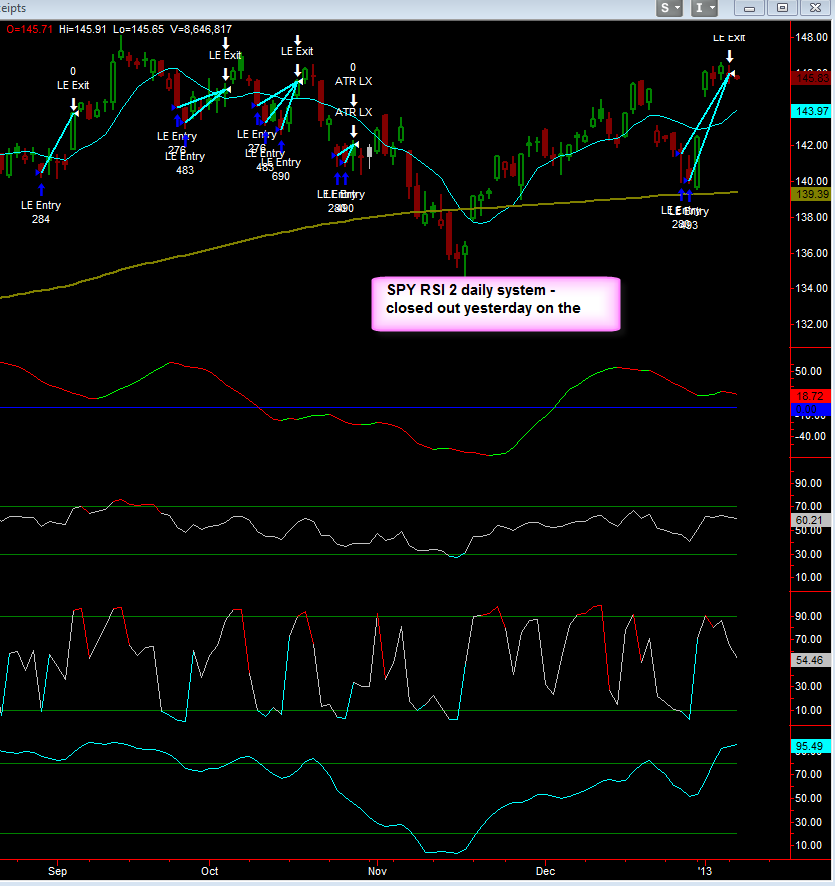
A follow up from the systems yesterday, the SPY daily modified system exited today on the open as I stated it would yesterday - this system is different than the RSI 2 system (which exited yesterday on the close), it exits longs on the next day open.  


Both the SPY daily RSI 2 and SPY daily modified systems are now flat and waiting on their next trade.  Please don't take their exit as a general sell signal or short for the market, remember that these are reversion to mean systems - they buy pullbacks in uptrends and short rallies in downtrends (they are not trying to short tops), and they are only in the market about 20  -30% of the time - their goal is to get in and get out, not to stay in the market for entire trends


All the systems are now flat, when they do another trade, I will let you know.


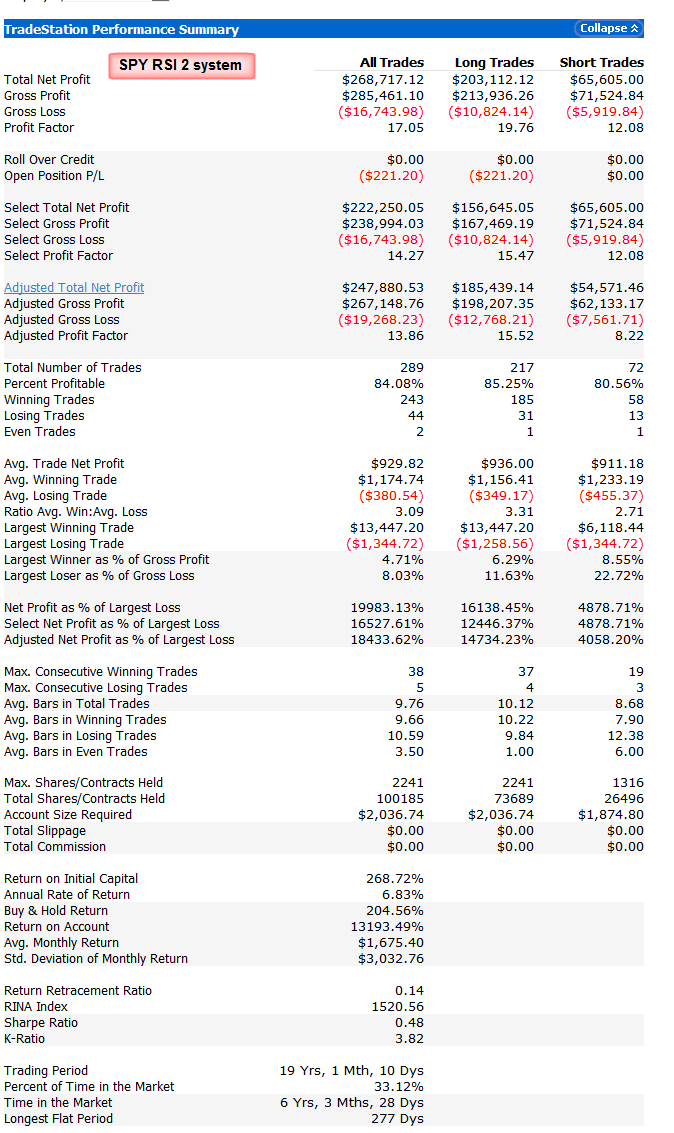
below are the performance reports showing all the statistics of the two SPY systems. 


SPY daily modified system performance report


SPY daily RSI 2 system performance report

Monday, January 7, 2013

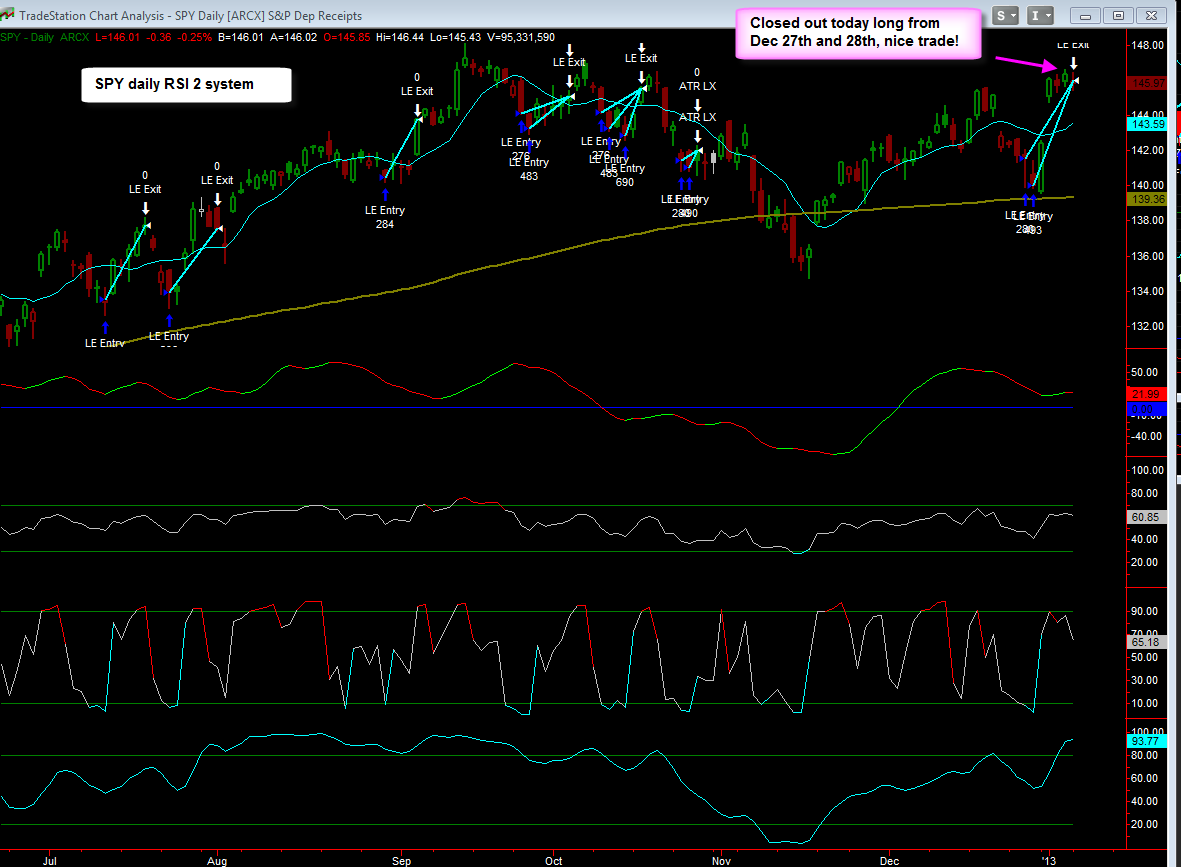
Just to confirm here's the chart of the SPY RSI ...

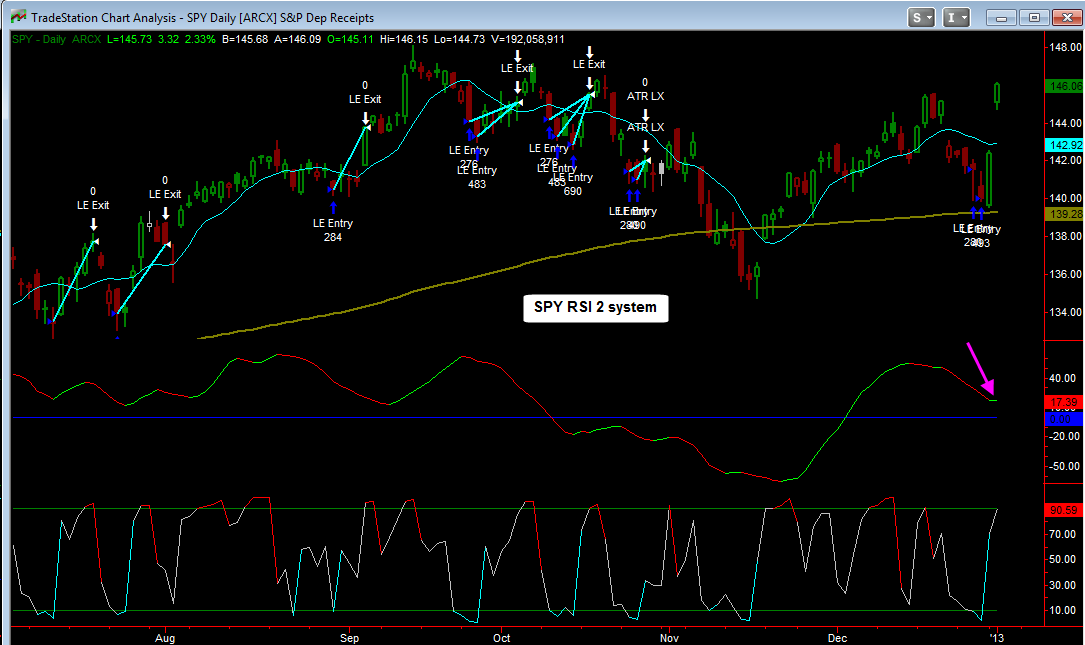
Just to confirm here's the chart of the SPY RSI 2 system - as you can see it closed out the long established back on Dec 27th/28th today at the close, very nice trade!!'


Here's an updated Performance report to the system -  click here


The other SPY system, which is the SPY daily modified system will be closing out it's long tomorrow morning on the open.


I will send out an updated Performance report to the SPY modified system tomorrow after it closes out - click here for the current performance report


AAPL charts and comments

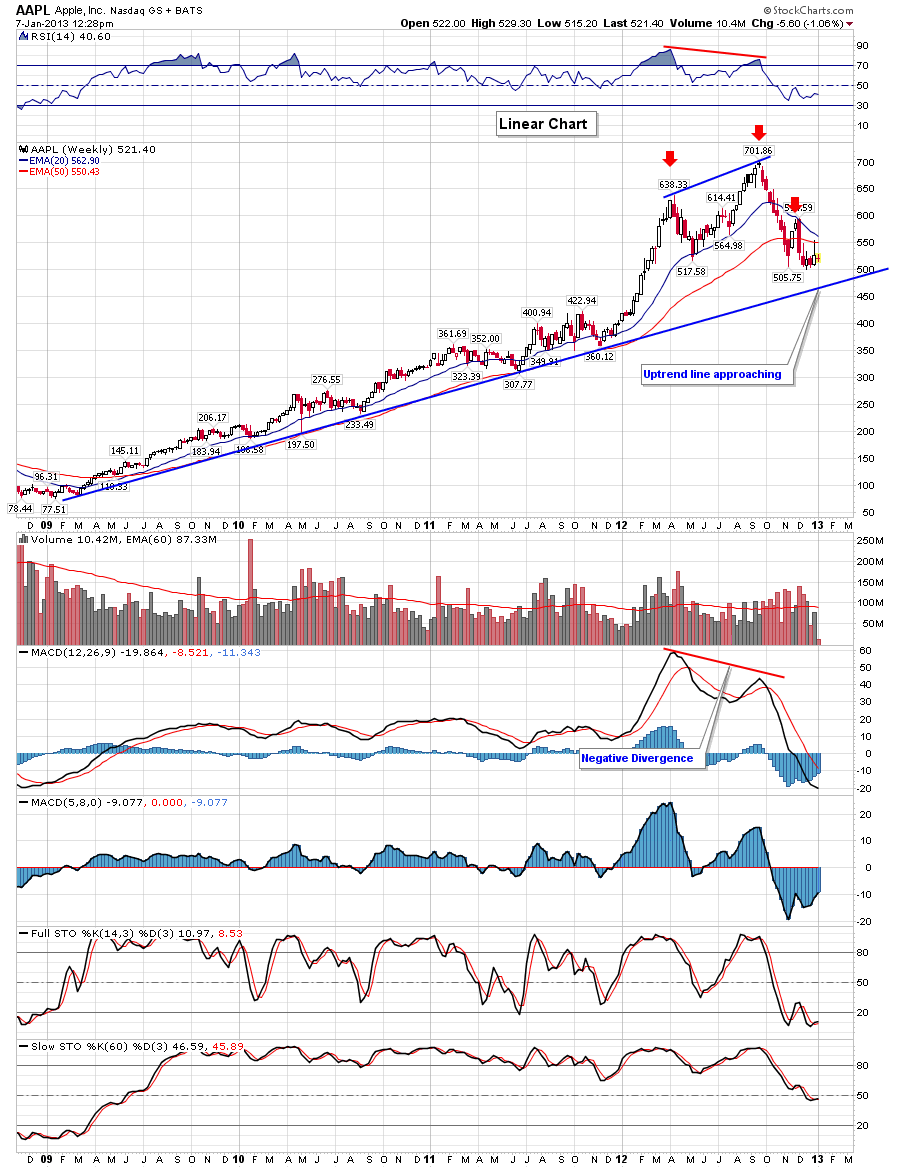
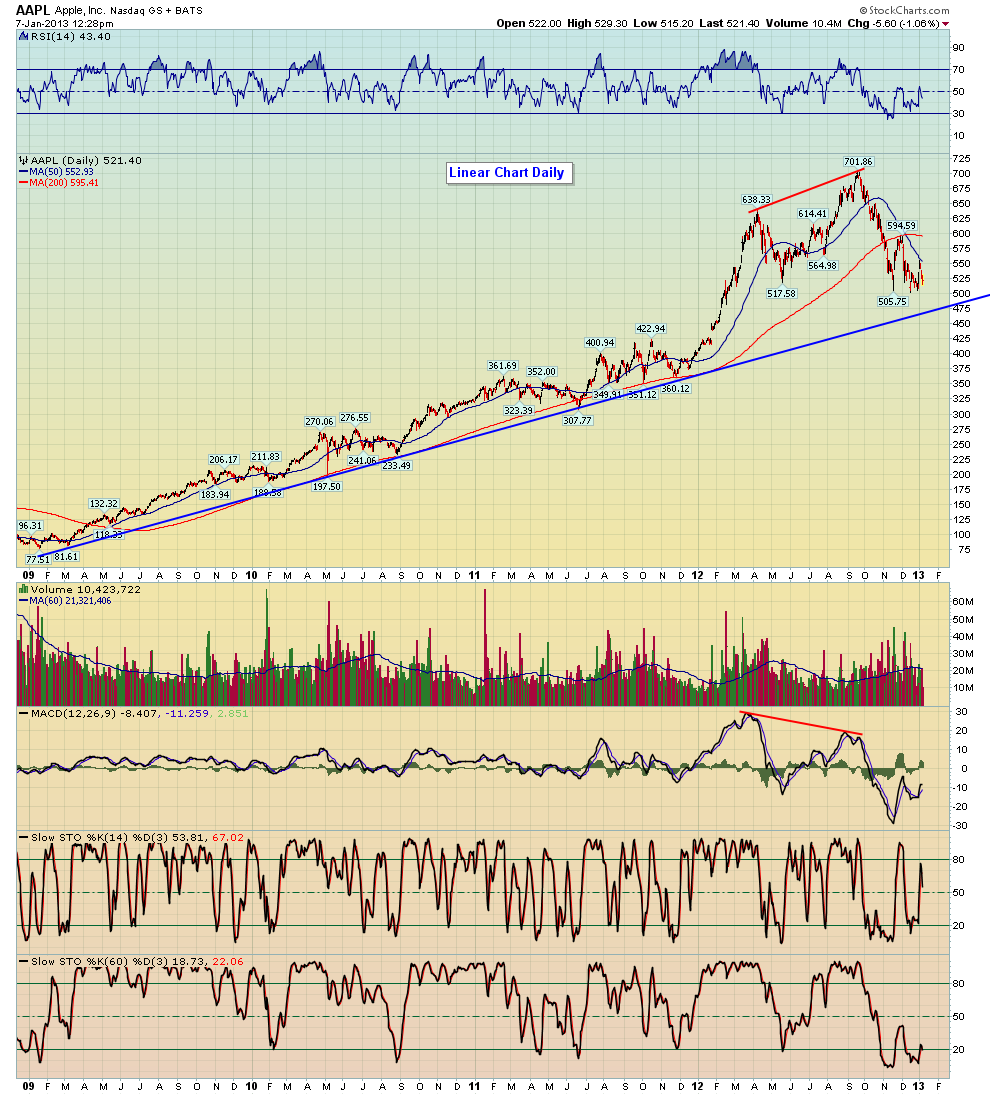
Here's three charts of AAPL, the first two show long term uptrend lines below that come in around the upper $400's around $475 etc.  Gosh, I would love to see another pullback in AAPL to test or get close to those trendline, I think it would present a buying opportunity at least for a trade, plus a tight stop could be employed just below the uptrend line.  Trading is all about taking trades with good risk/reward and buying AAPL nearing those trendlines with a tight stop would meet that criteria. 


the third chart is a daily chart, shows a downtrend channel

STP and PPHM - two of our recent stop picks

STP - Chart Link - STP doubled for us, we had it as a trade idea in early Dec when it was below $1.10 a share, yes it's down today, but the stock high $2, profits should have been taken


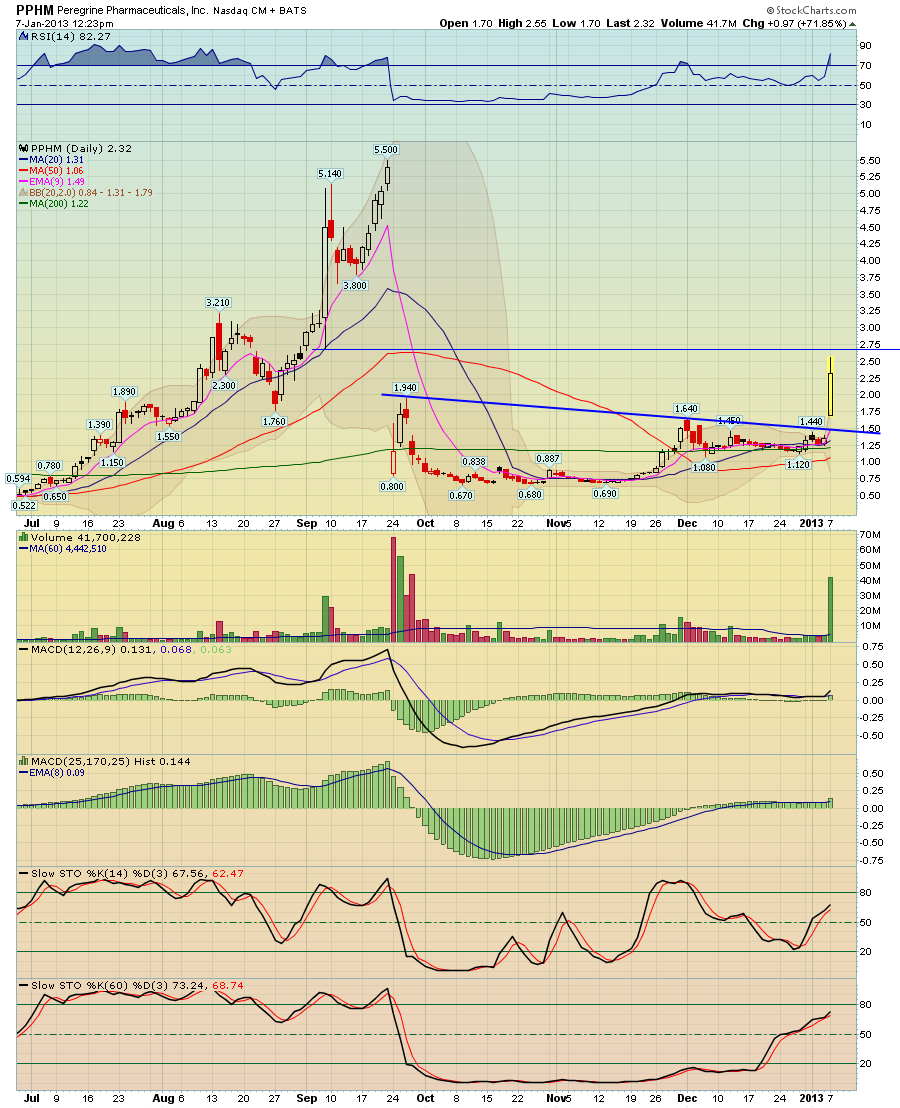
PPHM - Chart Link - here's one of our more recent picks - it is up $73% today, it was up over 90% at the highs.  


These are only two examples and these are cheap stocks, we post tons of trade ideas every week and the majority of them are much higher priced > $10, $50, $100 range etc  These two were just recent examples of some picks

Thursday, January 3, 2013

Our most recent Newsletter

Hello everyone, Happy New year!  Huge move on the market today and very nice trades for our mechanical systems.  I cover everything in this newsletter in detail so please take the time to review.


Click here to view the Newsletter


also we have a lot of exciting stuff coming to BPT this year so stay tuned...


Matthew Frailey

Wednesday, January 2, 2013

NYSE new 52 week highs

Very short term this indicator is overbought - so be a little cautious short term.

Moon cycle chart

Forget the idiots in Congress, the Moon Cycle was spot on! was late last week well ahead of the rally.

Just for confirmation - here'st the DVY chart, it closed ...

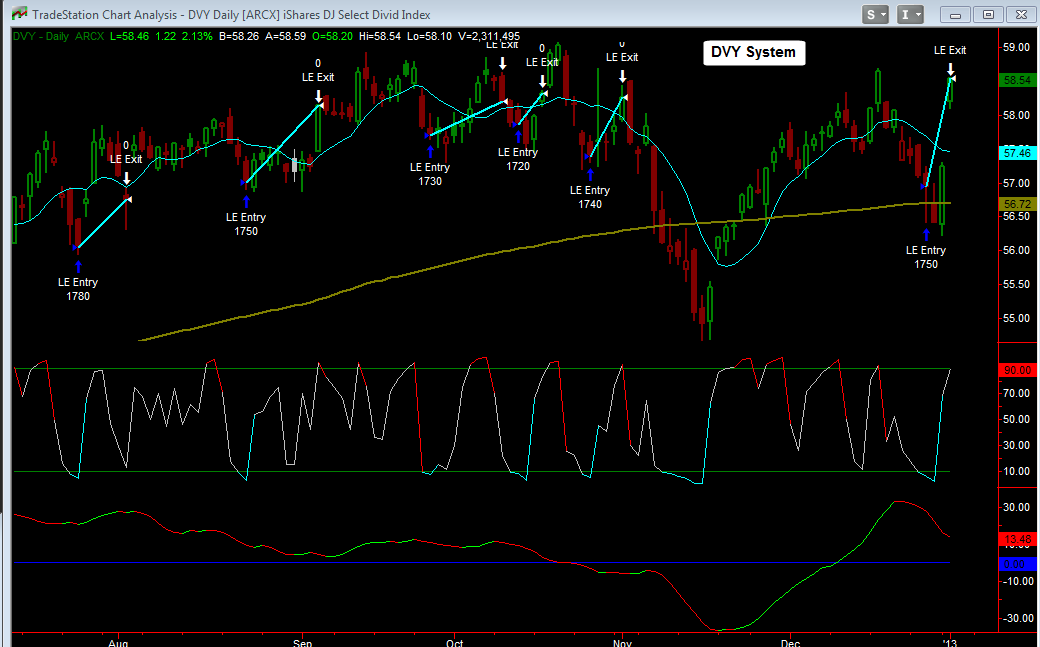
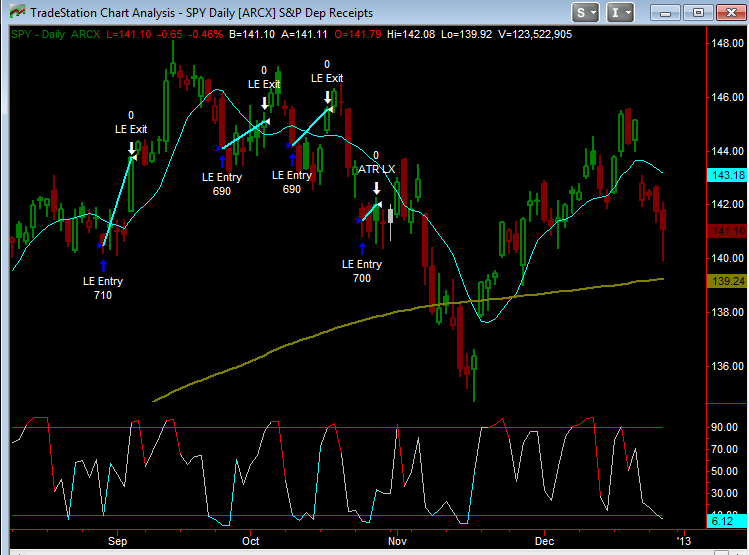
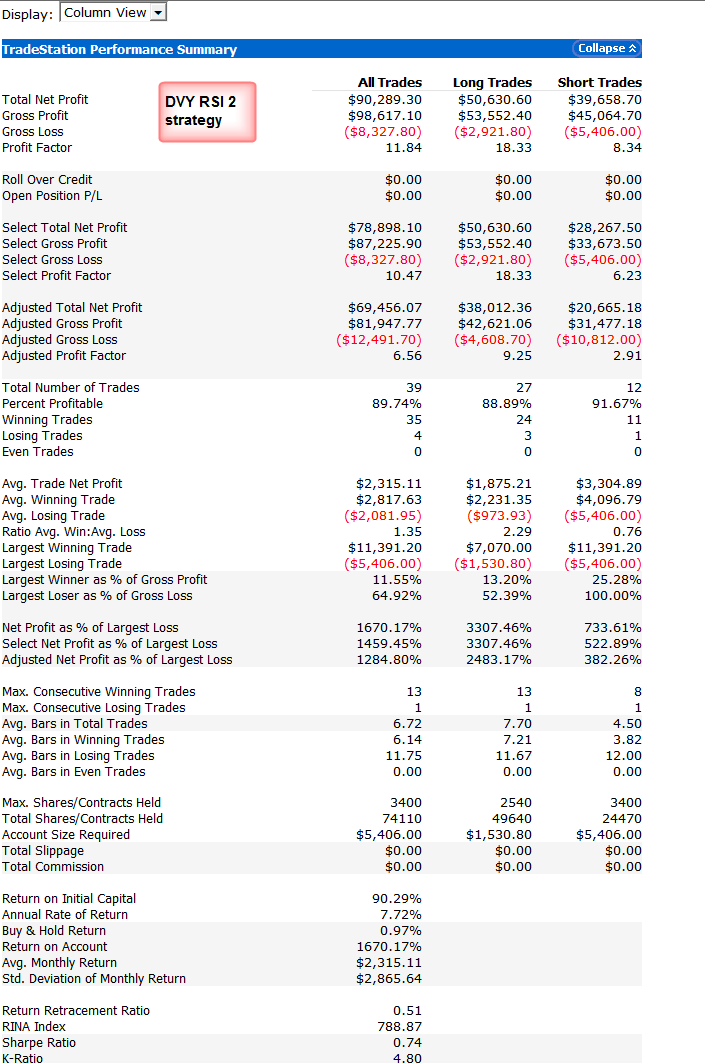
Just for confirmation - here'st the DVY chart, it closed out today at the close, I also included the stats.


However the SPY RSI 2 system did NOT close out at the close because the late day rally caused the trending indicator to turn green, the system will now hold until that turns red. 


The other SPY system is also still holding.

Reversion to mean systems update

Here's a quick video that I made on the systems:


Click here to watch the video


otherwise most of the systems went long last week on Dec 27th, most of them will be closing out today


the systems performance reports are listed below as well as their status (note the performance reports don't reflect today's close yet) - check back after the market closes for updated reports.


- DVY system will be closing it's long at the close


- SPY RSI 2 system will be closing its long at the close


- SPX RSI 2 system closed out on Monday


- SPY 60 min RSI system - will continue to hold its long


- SPY Alternate system - will continue to hold its long

Long Long term SPX system

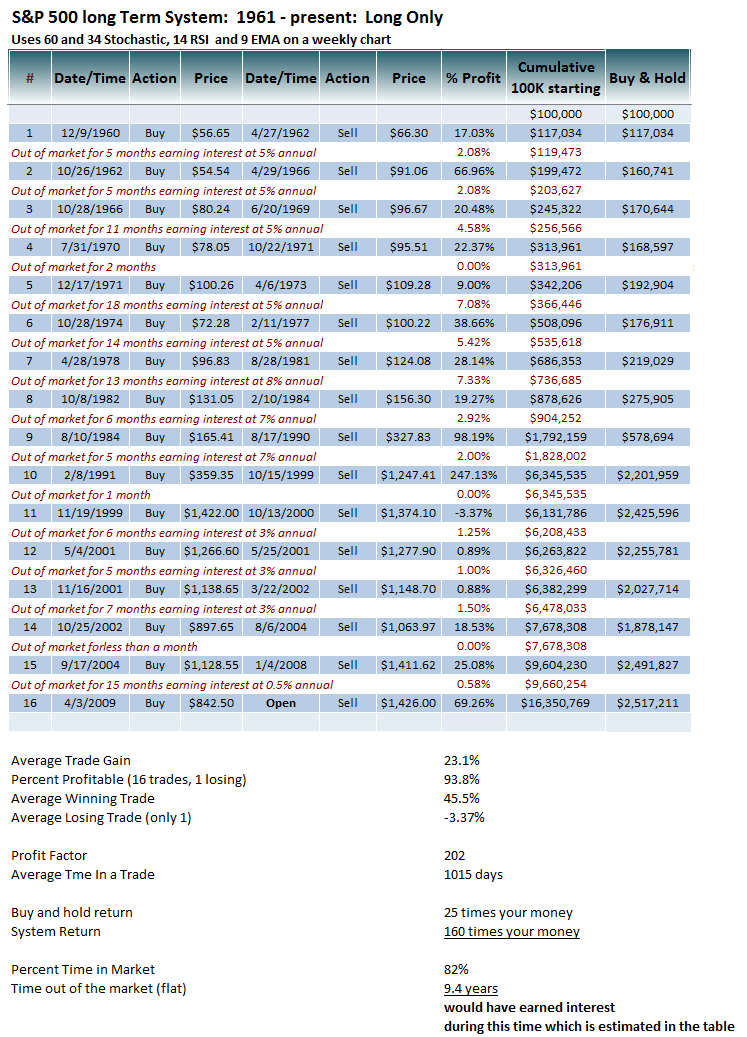
I had some questions about the long term SPX system in the long term tools section, which I haven't updated for quite a while.  Anyway I decided to simplify that system and thus changed it completely.  It's now very simple, in fact it only uses 60 and 34 Stochastics, and 14 RSI and 9 EMA - on a weekly chart.  It contains no moving average crossovers.  All I'm doing is for the primary signals using 34 Stochastic and 60 Stochastic above 50% for longs and below 50% for shorts (however a confirmation is needed - this means that when the 50% level is crossed, another candle must take out the previous candle high or low depending on if it's long or short.  I'm using the 14 weekly RSI only when it get's oversold (which rarely happens, and then using a confirmed crossover of the 9 EMA to enter a long - the confirmation works the same way for the 9 EMA as well.  You may recall that I showed this method the other day on the daily SPX using 14 RSI and a 9 EMA. 


The system is Long only, no shorts, it simply exits when there is a sell signal.  The times when it is in cash, I assume a modest interest rate gain for those times.  


system general stats going back to 1961:


buy and hold returned 25 times your money - or $100K turned into $2.5 million. 


system - Long only, returned 160 times your money - or $100K turned into $16.3 million


only 18 trades, 17 winning trades (average of 45.5%, one losing trade of -3.37%).  


average time in trade 1015 days


Percent time in the market 82%


time out of the market - 9.4 years


---


again while it is vastly better than buy and hold only, for 99% of us here it is not something that we would trade,  average hold time is nearly 3 years, one trade held over 8 years etc.  That's why I call it long long term system. 


Currently the system has been long since 4/3/09 - and isn't really close to giving a an exit signal yet.  Again all you have to do is see a weekly SPX chart and look at 34 and 60 Stochastics, they are not close to crossing below 50%.


anyway it was a fun exercise just applying simple rules.  Now I need to make a daily version with the same rules because the weekly is just too slooooowwww..
Sunday, December 30, 2012

Last Newsletters of 2012!


Hello everyone, 2012 is about to close out for good and I hope everyone of you has had a very good year!  I have enjoyed providing useful and insightful market analysis and commentary for you all year long, hopefully you have as well.


Here's our last two weekend newsletters for 2012:


- Commodity Weekend Newsletter Sunday Dec 30th


General Market Weekend Newsletter Sunday Dec 30th, 2012


.


Friday, December 28, 2012

NYAD indicator follow up

I posted this chart a couple weeks back in mid Dec before Christmas (see my post from Dec 19th) how there was an obvious negative divergence between the market S&P 500 and the NYAD NYSE Advance Decline issues indicator.  As you can see from the history, this divergence has been a good predictor of market pullbacks - now obviously we have the Fiscal Cliff fiasco in Washington with our idiot politicians as a major new catalyst, however the chart was also setup for a pullback well ahead of this.


At Breakpoint Trades we have a lot of custom indicators, charts, systems like this one to help you out with our trading


On Sunday night, congress meets again for the Fiscal Cliff, let's see what the 'yahoo's do, obviously the market will likely gap one way or the other on Monday morning.


Have a great weekend guys!

Thursday, December 27, 2012

RSI 2 systems

It looks like several of my RSI 2 market systems will go long today as long as RSI 2 stays oversold below 10%.  Here's some statistics and charts.  


Also I have a strategy on the ETF DVY, which is the DJ Select Dividend ETF, pretty good stats with an 11 PF and 89% winning trades.  


However again, realize that this is news driven market - so keep that in mind, I'm posting these charts as information purposes only