Thursday, November 20, 2014

Exhaustion Trade Statistics - rare setup and condition

Hello everyone, here's an important and rare technical event that is setting up on the market, I call it an exhaustion trade.  Click the newsletter link below to read more about it.  This is a condition that has only occurred 4 times in the last 50 years.


You can view the Newsletter Here click here.


enjoy the rest of your day,


Matthew Frailey

Exhaustion Statistics follow up

Hello everyone, here's a follow up to the exhaustion trade statistics:  Today is the 24th consecutive close above the 8 day SMA along with %K over 88%.  Over the last 50 years, this condition has only occurred 4 times, max draw down on $100,000 is only -$393! Target is a close back below the 8 day SMA over the next 4 - 5 days


Condition: On the SPX cash, price closes above the 8 day SMA for 24 consecutive days along with a 10 length %R indicator also closing above 88%.  


The key is that the SPX needs to close up for today with the %R staying over 88%, obviously we'll have to see how it looks near the close


the images below, the first one shows the current SPX chart, the second shows the Tradestation Statistics, the 3rd shows you the trade list, the last 4 charts show you every trade on the chart at that time, 2012, 2006, 1998, 1986, interesting thing to note is that note one of those instances was a major top, just a quick pullback then prices moved higher

Sunday, November 16, 2014

Free Newsletters on the General Market and Commodities

Hello All, I hope you had a nice weekend! Here's my two free comprehensive weekend newsletters


- CLICK HERE to view the Commodity Newsletter - quite a few trade ideas here: crude oil, natural gas, uranium, and precious metal gold stocks 


- CLICK HERE for the General Market Newsletter - quick discussion on the general stock market, BPT MA Deluxe trending indicator, and SPY Pro system.  Have a great week!


Matthew Frailey

Tuesday, November 11, 2014

SPX daily at resistance

$SPX - Chart Link - here's a daily chart of the S&P 500. As you know the market has had one hell of a rally of the Oct lows in a straight up V rally - in fact this is the fastest rally in terms of percentage gained over time in history.  Clearly the market will need to rest soon, perhaps this trendline will offer some resistance

Sunday, November 2, 2014

Free Breakpoint Trades Market Newsletters

Hello everyone, I hope you enjoyed your weekend, and October is finally over, what a wild month! Here's my free weekend newsletters.  


CLICK HERE for the Commodities Newsletter


CLICK HERE for the General Market Analysis Newsletter


enjoy the rest of your week!


Matt

BPT MA Deluxe using 60 min chart to get better prices follow up

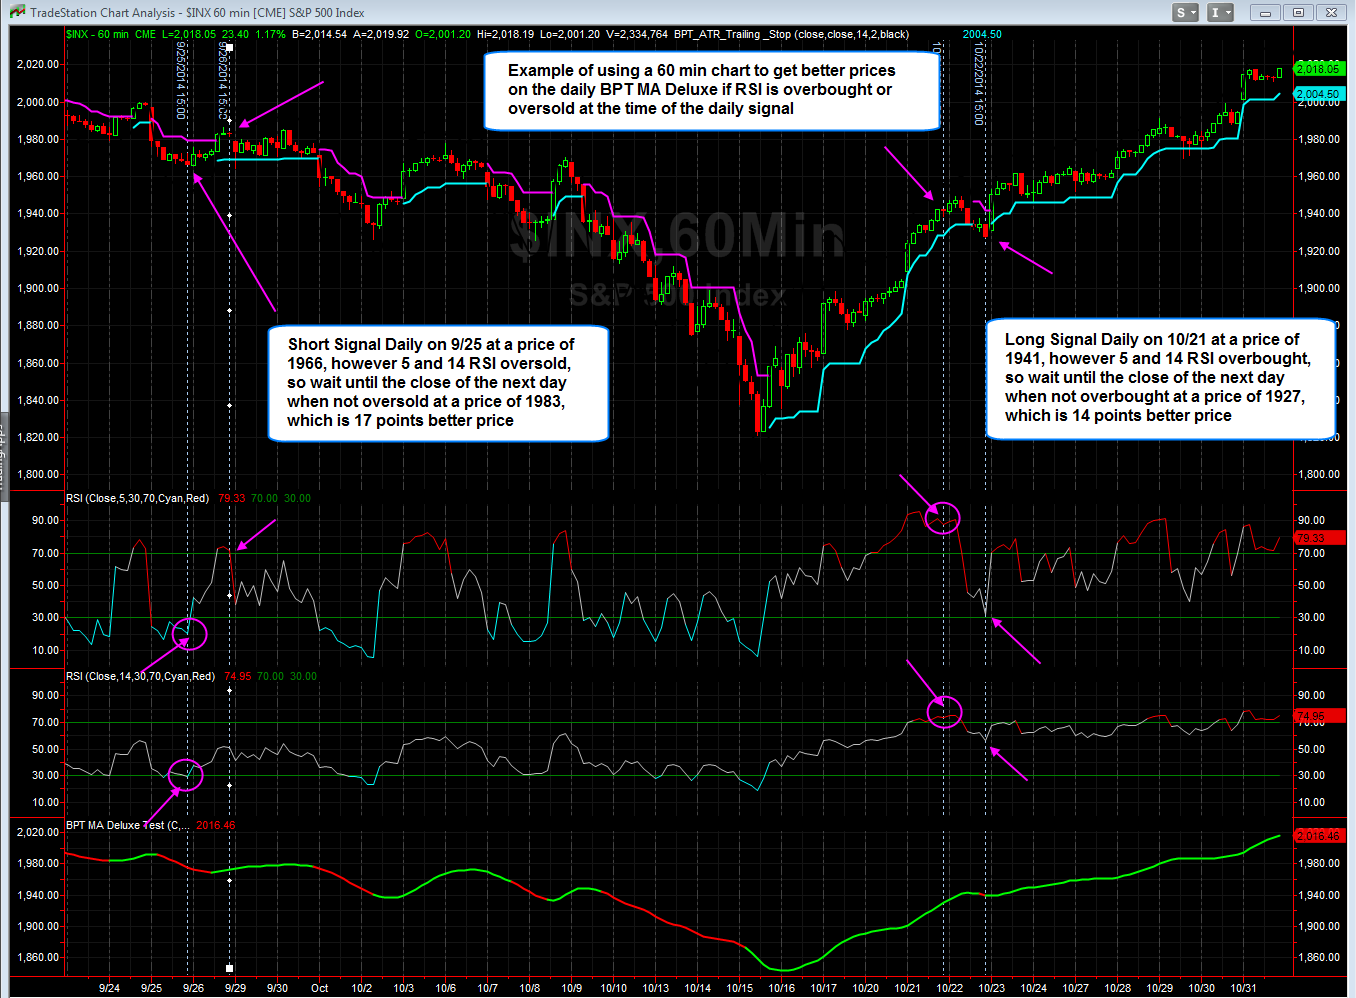
Hello guys, last weekend as you know I showed you some examples how when the daily BPT MA Deluxe gives a trade signal on the daily SPX chart, that one could zoom down to a 60 min chart to get better prices if the 5 and 14 RSI's were overbought (for longs) or oversold (for shorts), and you simply wait until the next day when these RSI's recycle. This of course is just common sense and could be improved upon a lot, however this exercise is to get you out of the 'robot mode' about taking the daily charts without looking at your intra day charts and other factors.  


The first image shows you two tables, the one on the left shows you the trade signals based only on the daily chart. The table to the right shows you the dates and prices if you used a 60 min chart to get better prices a day later if the RSI's were overbought or oversold at the time of the daily signals. If you look at the table, not every signal is better or different, in fact many of them do not change the daily signal (if RSI was not at extreme levels on the 60 min chart at the time, I simply take the daily signal as is).  For the columns, compare the dates, the # of days, and points better,and % Gain columns.  


The difference you will see is that some of the trade signals you are able to get 10 - 17 points better prices on the SPX. Also you will note that the average trade time jumps from 43 to 46 days, which is just common sense since you are typically waiting a day or so longer using the 60 min.


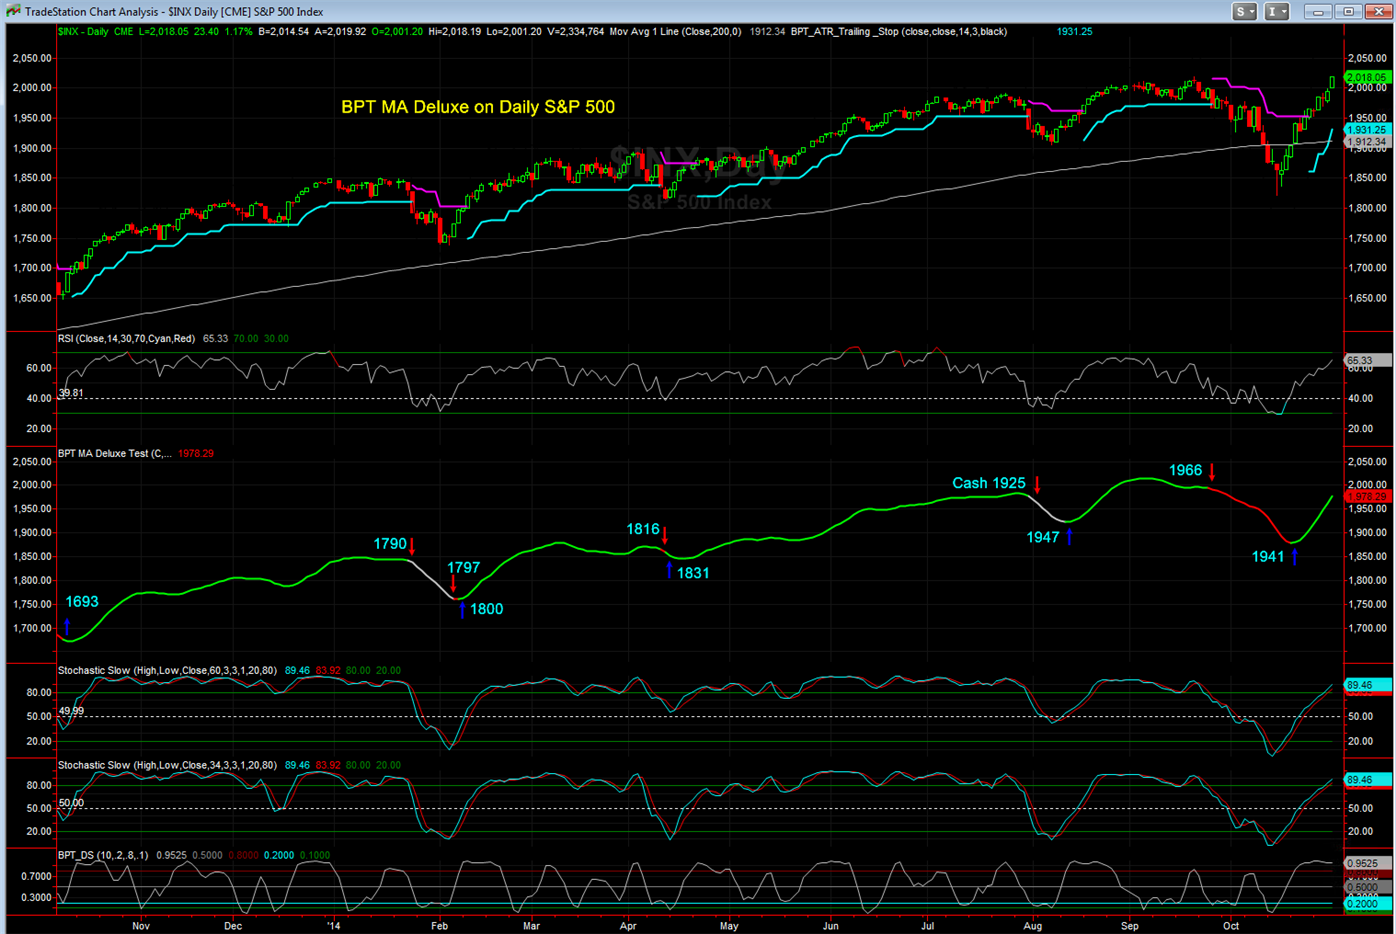
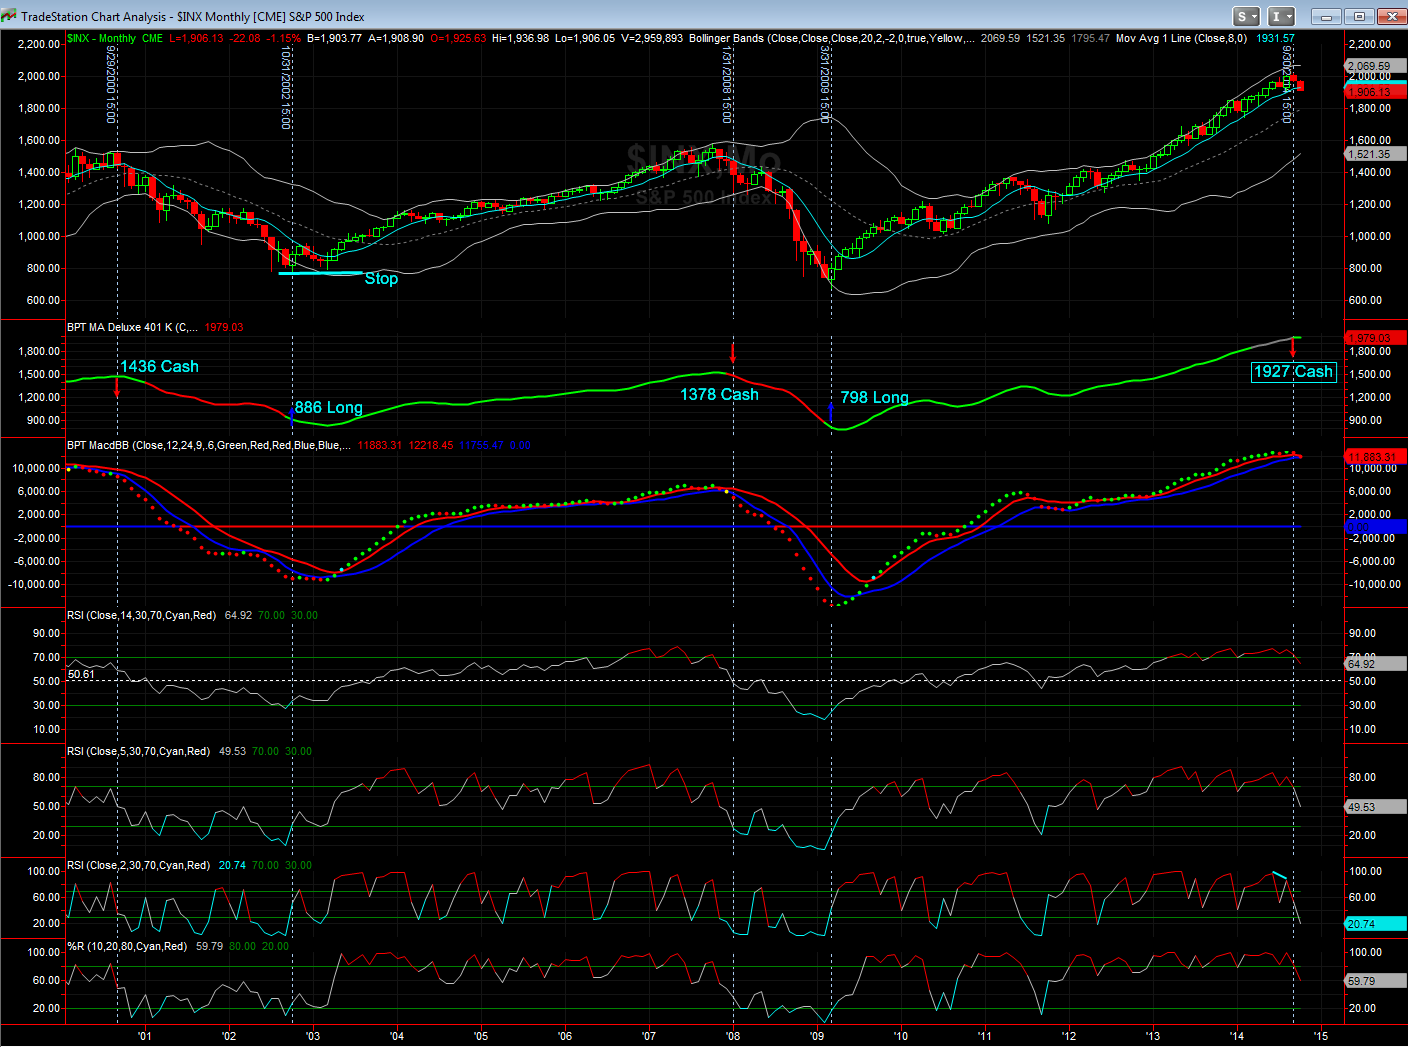
- The second image below shows you the daily SPX with BPT MA Deluxe signals noted (non - 60 min modified)


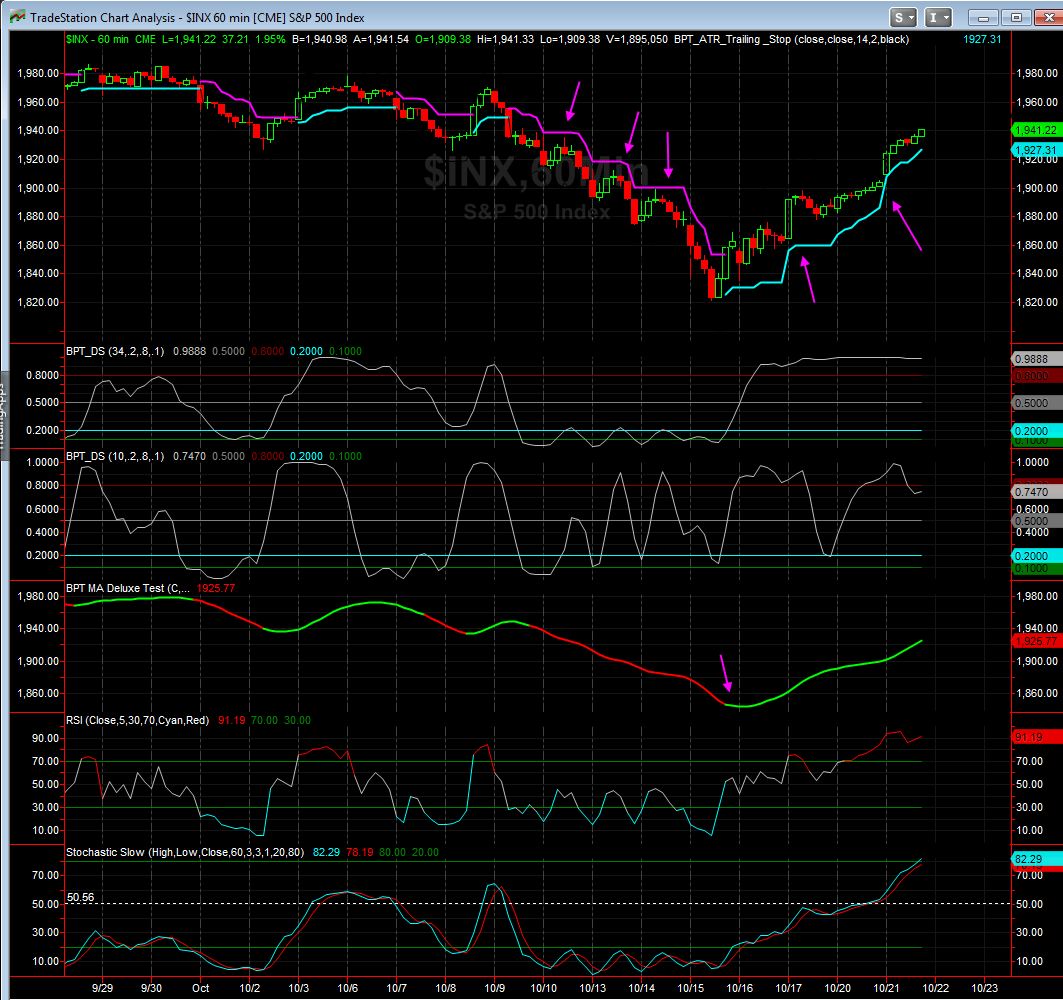
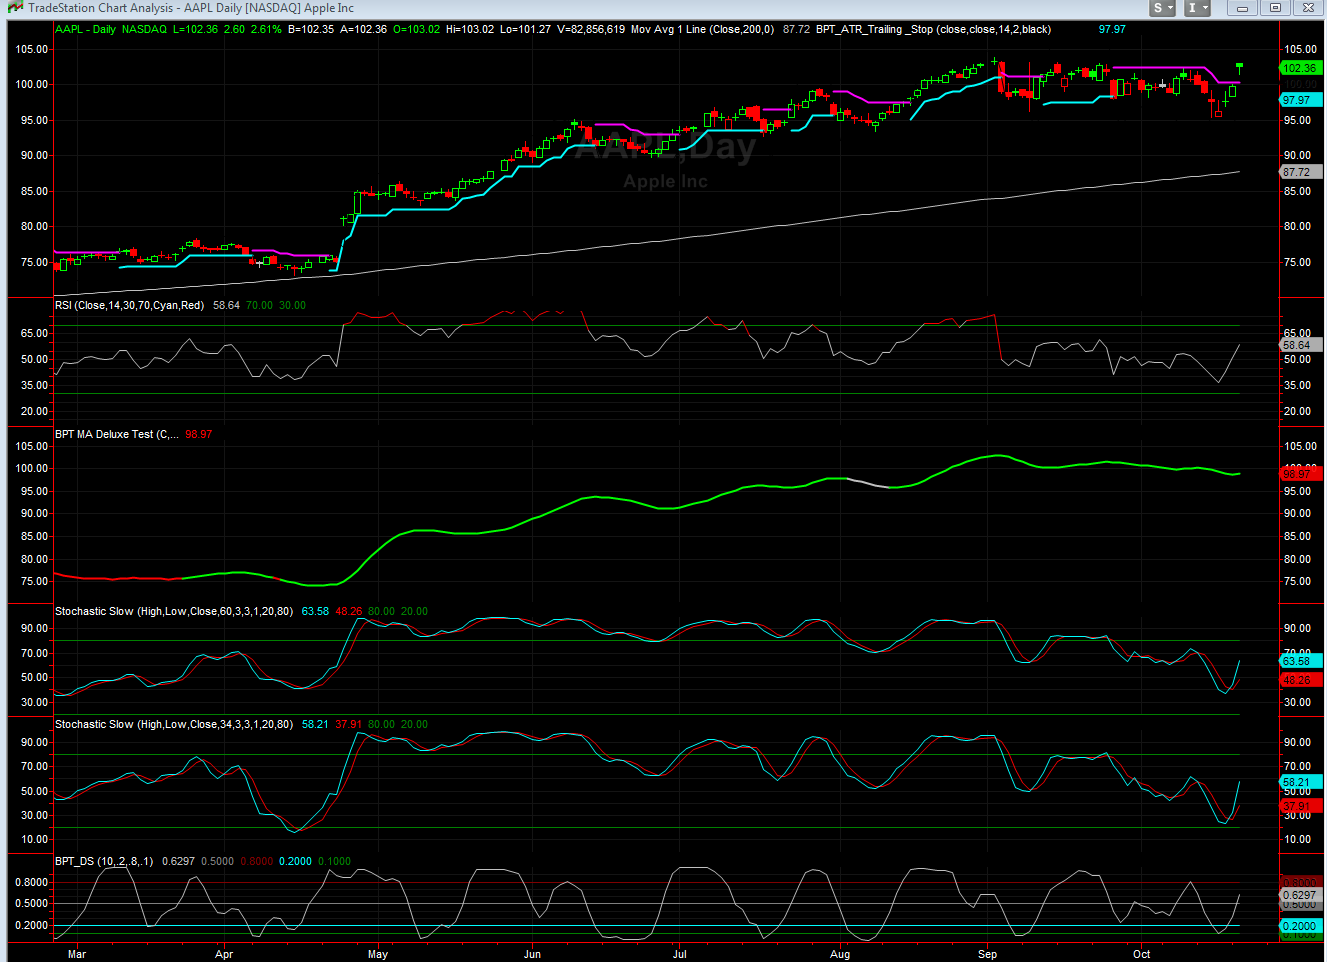
- The 3rd image below shows you the Current SPX with BPT MA Deluxe and the new signals based on 60 min


- The 4th image shows you a 60 min chart showing the current long trade, which would have been taken at 14 SPX points better prices, and the previous cash trade which would have been taken at 17 SPX points better prices.


I have not decided yet, I may in the future show the daily chart with the 60 min modification - however I would have to let you know in real time of course.

Thursday, October 23, 2014

GDX comments

GDX - Chart Link - as you know GDX has been under performing and that had not been good for the metal.  However down in here it may be prudent to keep an eye on it, the trend is down and it has been down for a long time, however down in here there is potential for it to form a small bull wedge if it chops around here for several days or a week or so, and notice the MACD divergence forming.  Now if GDX just craters down hard, this potential pattern will be lost, however if it continues to just chop around it may be something to keep an eye on.  In the short term monitor the MACD for a kiss potential - notice the pattern from late Dec 2013 as an example

Tuesday, October 21, 2014

60 min SPX

price simply holding the ATR indicator and BPT MA Deluxe on 60 min went green on the 15th.  


on a side note my programmer is working on an online charting software, we may be able to code the BPT MA Deluxe into it so folks can watch it intra day and put it on various stocks and other things - that's gonna be a while still.  


here's a chart of AAPL with the BPT MA Deluxe for example, same settings as the SPX, it's done pretty well ignoring most of the noise and staying in the trend.

Sunday, October 19, 2014

Weekend Newsletters

Hi Guys, hope you had a nice weekend, here's my newsletters!


- General Market Newsletter


- Commodity Newsletter


take care and good trading,


Matthew Frailey

Wednesday, October 15, 2014

Market Newsletter - take a look

Hello everyone, here's my recent newsletter, as you know the extreme volatility continues, the Dow was down over 400 points at one point, however many sectors and indexes rallied back quite a bit from the lows.  Could today have marketed some sort of capitulation day for the market and put in the major wave A that we've had on our charts? Perhaps, too early to day for sure, however some sectors like XLE energy, small caps, Semi conductors etc closed positive.  Review the newsletter for my thoughts and a few trade ideas.


Matthew Frailey


You can view the newsletter here.

Sunday, October 12, 2014

Important Market Update on our 401K system and the General Market

Hello everyone, as you know the BPT 401K Paint Dry System has been in cash for a while and had been expecting a good market correction, now that we've had a good market pullback, here's an detailed update on the BPT 401K Paint Dry System.  I include a short discussion, however make sure to watch the included 20 min video in the newsletter.


CLICK HERE for the 401K BPT Paint Dry System


Also here's a link to our General Market Newsletter this weekend, again anyone who has been following us should know that we have been expecting this market correction


CLICK HERE for the Weekend General Market Newsletter for Oct 12th, 2014


Matthew Frailey

Wednesday, October 8, 2014

Newsletter and managed futures service

Hello everyone, here's my newsletter on the market, which has been very volatile lately and today we had a big rally after the FOMC.  Make sure to listen as I discuss some swing trade potential ideas to monitor.  Please note that it may be a little hard to understand me since I'm under the weather (you will be able to tell from my voice).


CLICK HERE to view my market newsletter


Also I wanted to let you know that we have a manged futures service, how it works is you open an Interactive Brokers account and link it to our Efloor account, and when our automated futures systems take a trade, they will be automatically executed in your account, so for those of you who don't have time to trade and are comfortable with systems and futures, this maybe be something that interests you, click the newsletter link below to read more about this:


CLICK HERE for information on the manged futures service


Matthew Frailey

BPENER and XLE

$BPENER - Chart Link - the BPENER hit 11% today, that's very low.  Also note the reverse divergence in place regarding price and the indicators, this may signal a low


$BPENER - Chart Link - Renko Chart


XLE - Chart Link - 

Sunday, October 5, 2014

Here's our most recent Market Newsletter for Monday Oct 6th, 2014

Here's our most recent newsletter, this one is very comprehensive and and very long as it discusses both the general market and commodities.  I hope you enjoy this comprehensive free newsletter


CLICK HERE to view the newsletter


have a good week!


Matt

Wednesday, October 1, 2014

BPT MA Deluxe Powerful Market Indicator

Hello everyone, here's a chart of my powerful BPT MA Deluxe market trending indicator, it doesn't catch exact tops or bottoms, but it does very well catching trends.  Here's a current chart showing the last year and a statistics table showing trades going back to 2010, out of 37 trades only 4 losing trades and the largest losing trade was less than 2%, that's not bad.  Also the average hold time is 45 days so it's easy to follow even if you work a busy day job, and some trades last as long as 3 to 6 months with a couple of them lasting about 200 days!


This powerful market indicator comes free with a BPT membership, which is only $50 a month, just one trade should easily pay for your membership many times over and you can expect an average of 3 - 5 trades in a 6 month period. 


Here's a link to our signup page, consider signing up to our 6 month membership!