Wednesday, January 7, 2015

Wednesday Jan 7th, Newsletter

Hello everyone, here's tonight's newsletter, once again there are quite a few charts and the audio portion is longer than average, however this newsletter (like the previous 2) contains a lot of educational content, so it behooves you to take the time to listen, plus there's some nice trade ideas as well.


CLICK HERE to view the Newsletter.


Also our 25% membership sale ends in 3 days

Tuesday, January 6, 2015

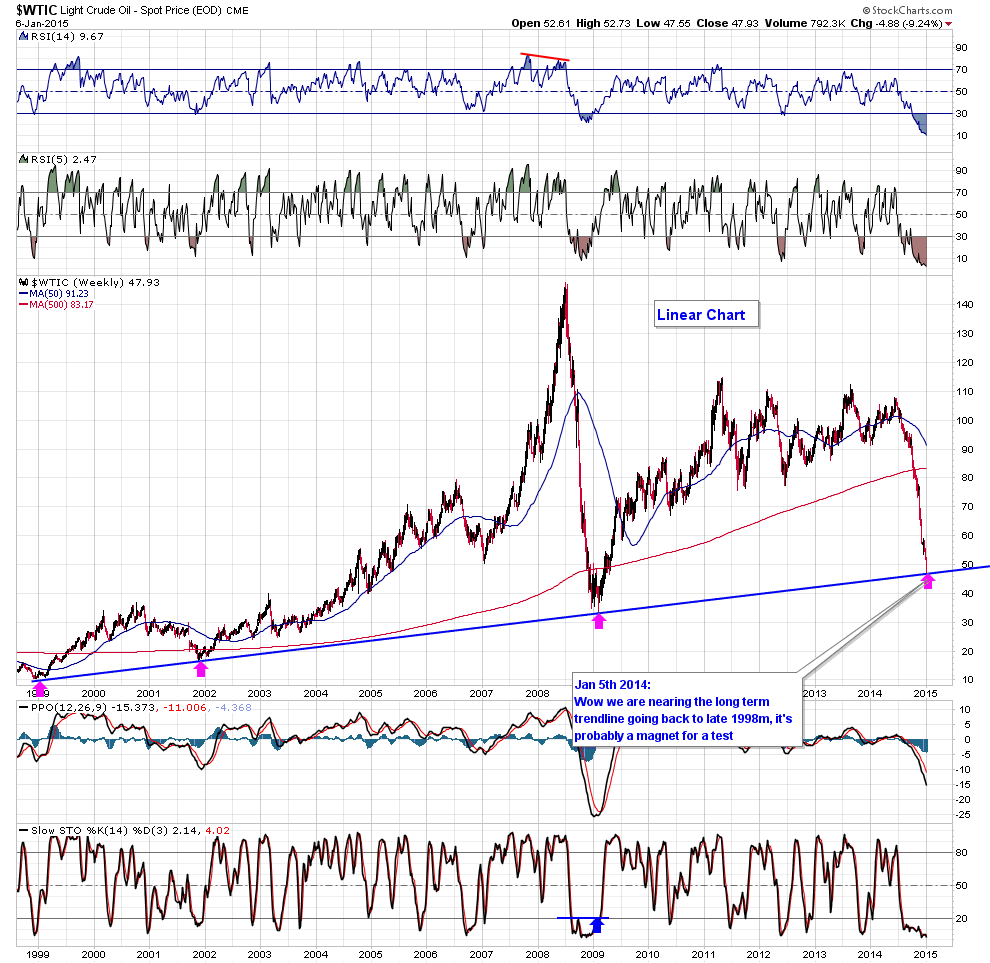
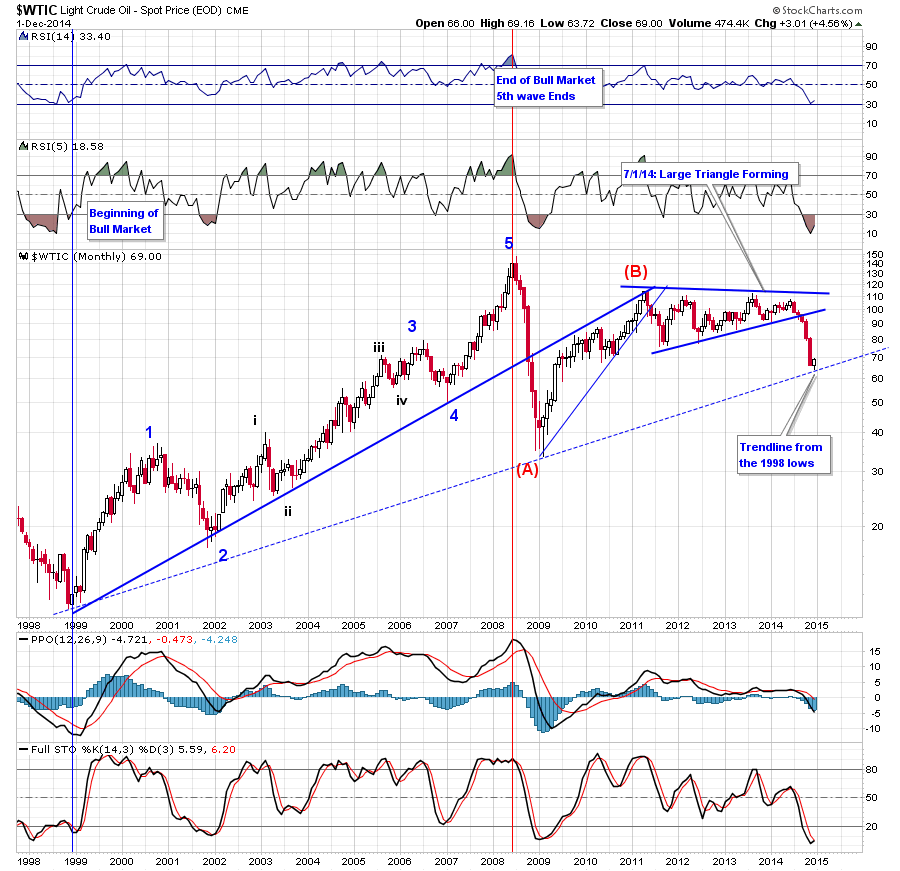
Crude Oil now testing trendline from 1998

$WTIC - Chart Link - amazing sell off this year, testing the long term trendline now.  We may be close to a bounce, however I still feel like we may need a short term capitulation where price sells off strongly in the morning and and goes below this line, and bounces back intra day to form a hammer - we need a washout in this market to rinse out the weak remaining longs and bottom pickers.

Monday, January 5, 2015

Crude Oil is nearing the long term trendine going back to 1998

Wow, Crude Oil is nearing the long term trendine going back to 1998, that trendline is probably a magnet in the short term.

BPT MA Deluxe comments

Price close just above the ATR trialing stop indicator today, remember last week I mentioned how far price was above it, it was too far, now it's come back to it, will either act as support or slice through it.  However you can think of the ATR like a MA, when price gets too far from it, it will always be reeled back in.


a few other comments:  notice that the 60 stochastic closed just above 80%, the 80% area can act as a support level at times. Also the 14 RSI is near 40%, that's also an area to monitor.


again we have that open gap below as well, maybe we fill that then try to bounce, if not then will get uglier

PM gold/silver stocks follow up with comments

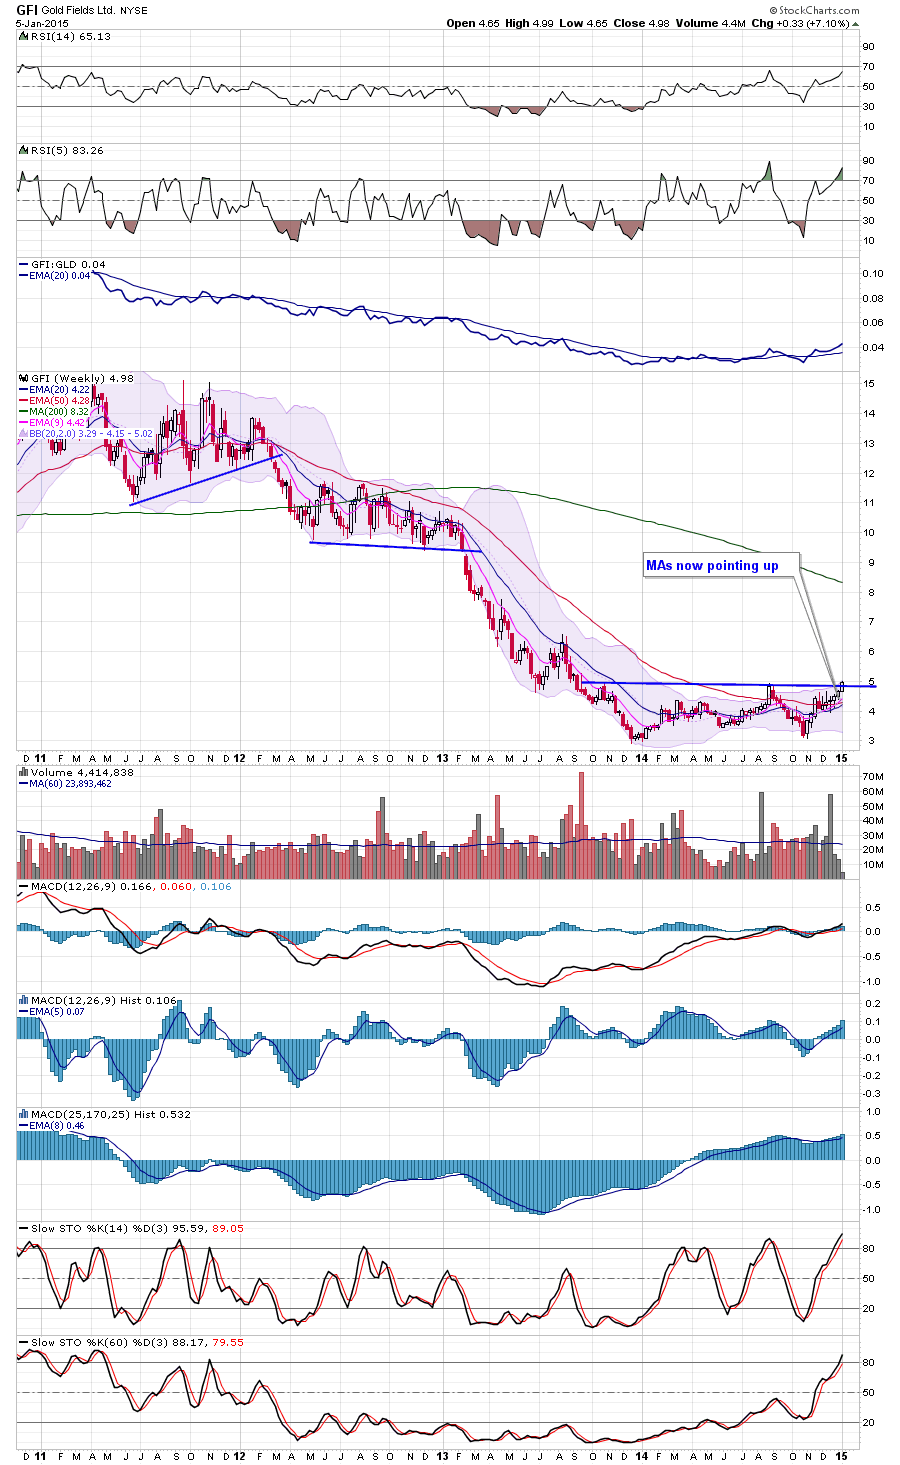
HMY - Chart Link - here's some that I've had in recent newsletters, I like to keep an eye on the moving average configuration, that's a concept taught in the tutorials, I commented how it had went positive on HMY last week, here's some others that I have commented on


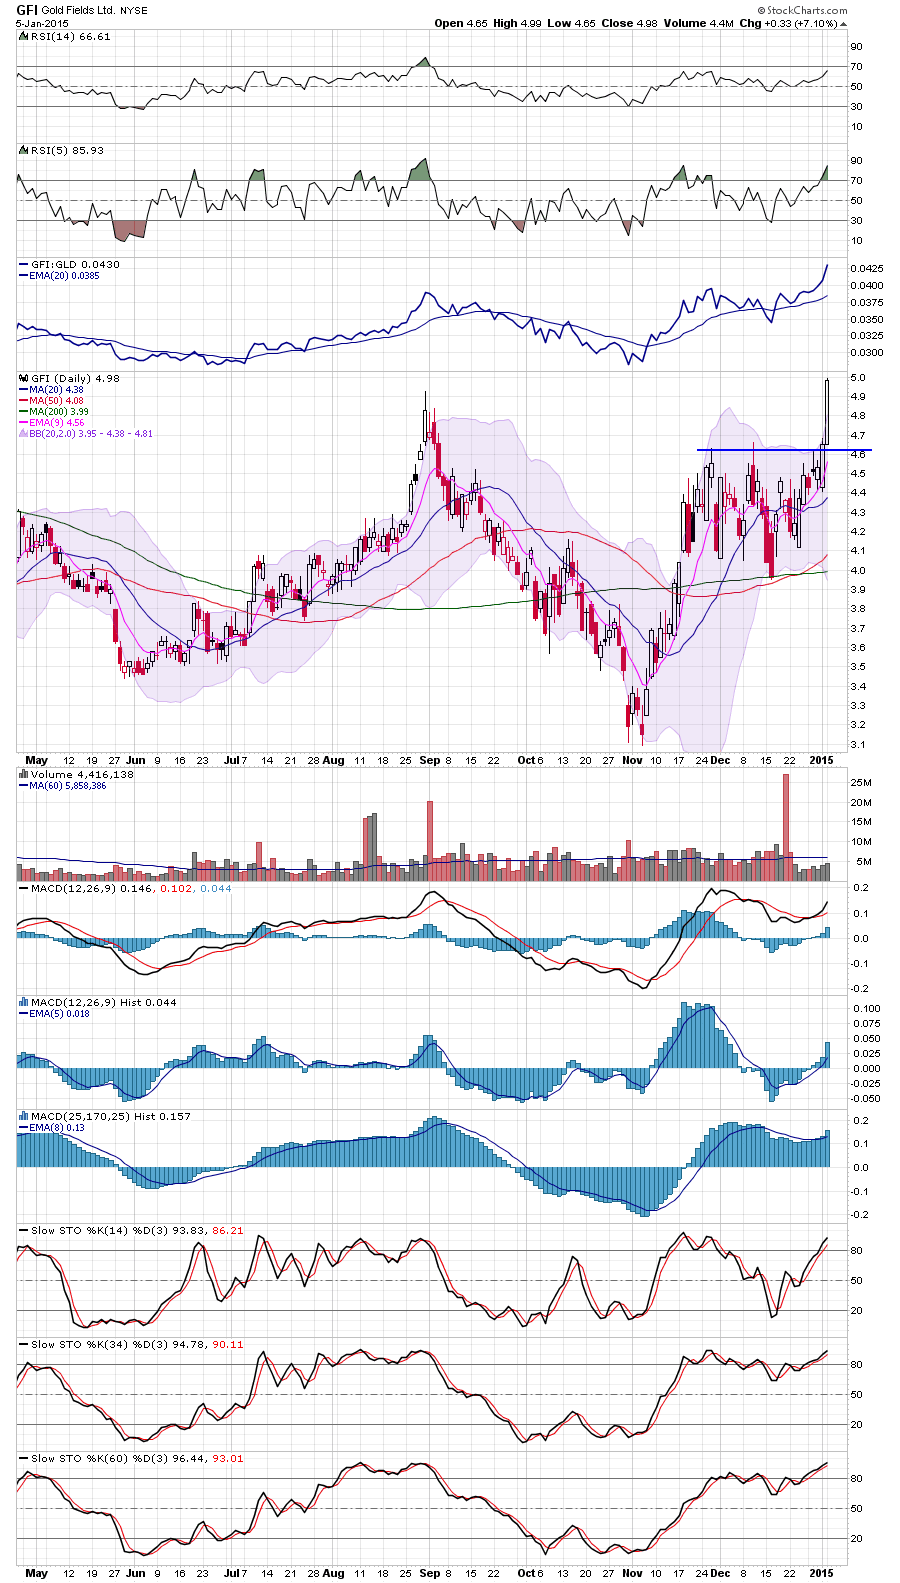
GFI - Chart Link - weekly MA configuration is bullish, big pop today


GFI - Chart Link


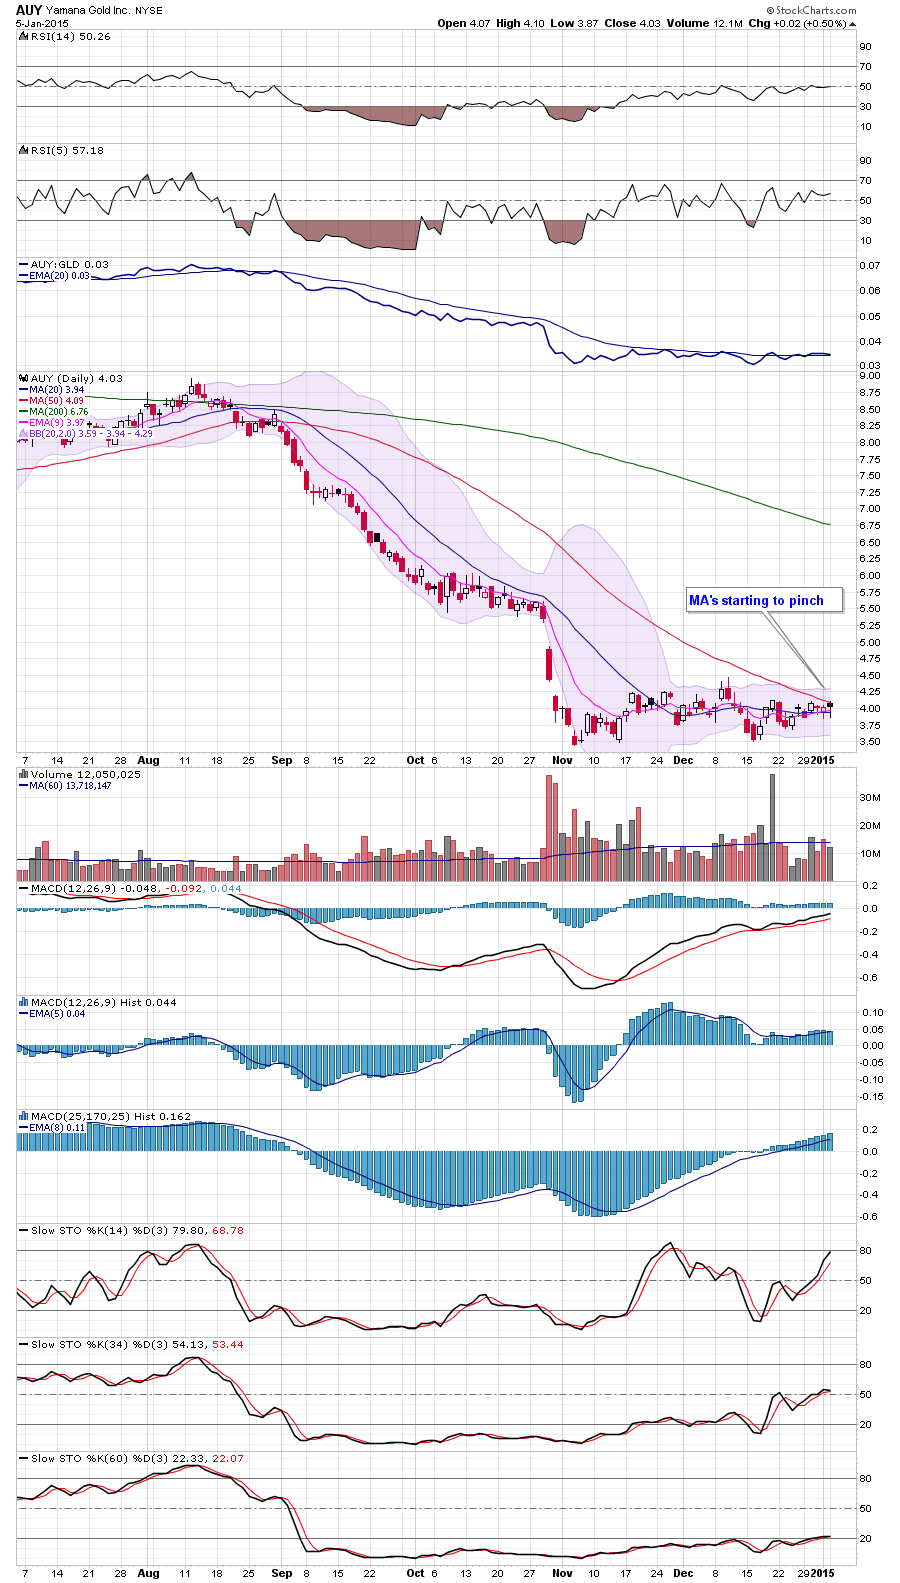
AUY - Chart Link - the MA configuration has not turned positive yet, but it's something to monitor if it starts to turn up


SIL - Chart Link


GOLD - Chart Link - keep an eye on the MA config


AGI - Chart Link - one I mentioned last week


AG - Chart Link - one I mentioned last week


AR.TO - Chart Link - one I mentioned a couple weeks back, watch for a higher low

Monday, December 15, 2014

Monday Dec 15th Market Newsletter and end of year special!

Hello everyone, I hope all is well, here's my free market newsletter!  By the way, as you know last week when I emailed you my free Wednesday newsletter, I accidentally sent you a bad URL, many of you wrote in to let me know  Anyway this URL works just fine. The market has had a nice sell off since last week Monday when I sent out my newsletter warning you about the market. Click the newsletter below to see my thoughts now:


CLICK HERE to View the Newsletter.


also see our end of year sale below:


---


End of Year Sale 25% Off 6 month membership!


Also it's now Dec 15th, and I'm having an end of year sale for Breakpoint Trades.  Here's a coupon code for 25% off our 6 month membership!  354FD7FE 


Just enter the coupon code above on the payment form when you sign up. This ONLY works for our 6 month membership!  


Remember besides our newsletters we have powerful mechanical systems that come with membership such as our SPY Professional System, which has an amazing 96% winning trades and closed out a nice winning trade last week!  CLICK HERE to read about this system


We have powerful trending indicators like our BPT MA Deluxe, which has been awesome at catching trends - just look at these returns CLICK HERE


So take this opportunity to signup and use this coupon for 25% off!


hope to see you as a member!


Matthew Frailey

Monday, December 8, 2014

Monday Dec 8th Newsletter - caution in order for the market

Hello everyone, here's my free market newsletter.  We feel that caution is now in order pertaining to the market.


CLICK HERE to view the Newsletter

Monday, December 1, 2014

Crude Oil bounced off the trendline from 1998

$WTIC - Chart Link - hello everyone, here's a followup to my weekend newsletters where I discussed crude oil.  Today crude oil had the largest bounce in over 2 years, however that's coming off the largest selloff from last week in years.  Anyway as you can see from my monthly and weekly charts, crude oil bounced off the uptrend support line from 1998 that I had in place


$WTIC - Chart Link

Sunday, November 30, 2014

Free Market Newsletters for Sunday Nov 30th, 2014

Hello everyone, first off I hope you all had a nice Thanksgiving and a nice weekend so far. Here's my free market newsletters for the weekend.  Please note that this time instead of just a simple audio overlay, I included a lot of written text to help you focus on the charts of importance, hopefully this helps you quite a bit!


CLICK HERE for the Commodity Newsletter


CLICK HERE to the General Market Newsletter (SPX, Indexes)


enjoy the rest of your weekend!


Matthew Frailey

Thursday, November 20, 2014

Exhaustion Trade Statistics - rare setup and condition

Hello everyone, here's an important and rare technical event that is setting up on the market, I call it an exhaustion trade.  Click the newsletter link below to read more about it.  This is a condition that has only occurred 4 times in the last 50 years.


You can view the Newsletter Here click here.


enjoy the rest of your day,


Matthew Frailey

Exhaustion Statistics follow up

Hello everyone, here's a follow up to the exhaustion trade statistics:  Today is the 24th consecutive close above the 8 day SMA along with %K over 88%.  Over the last 50 years, this condition has only occurred 4 times, max draw down on $100,000 is only -$393! Target is a close back below the 8 day SMA over the next 4 - 5 days


Condition: On the SPX cash, price closes above the 8 day SMA for 24 consecutive days along with a 10 length %R indicator also closing above 88%.  


The key is that the SPX needs to close up for today with the %R staying over 88%, obviously we'll have to see how it looks near the close


the images below, the first one shows the current SPX chart, the second shows the Tradestation Statistics, the 3rd shows you the trade list, the last 4 charts show you every trade on the chart at that time, 2012, 2006, 1998, 1986, interesting thing to note is that note one of those instances was a major top, just a quick pullback then prices moved higher

Sunday, November 16, 2014

Free Newsletters on the General Market and Commodities

Hello All, I hope you had a nice weekend! Here's my two free comprehensive weekend newsletters


- CLICK HERE to view the Commodity Newsletter - quite a few trade ideas here: crude oil, natural gas, uranium, and precious metal gold stocks 


- CLICK HERE for the General Market Newsletter - quick discussion on the general stock market, BPT MA Deluxe trending indicator, and SPY Pro system.  Have a great week!


Matthew Frailey

Tuesday, November 11, 2014

SPX daily at resistance

$SPX - Chart Link - here's a daily chart of the S&P 500. As you know the market has had one hell of a rally of the Oct lows in a straight up V rally - in fact this is the fastest rally in terms of percentage gained over time in history.  Clearly the market will need to rest soon, perhaps this trendline will offer some resistance

Sunday, November 2, 2014

Free Breakpoint Trades Market Newsletters

Hello everyone, I hope you enjoyed your weekend, and October is finally over, what a wild month! Here's my free weekend newsletters.  


CLICK HERE for the Commodities Newsletter


CLICK HERE for the General Market Analysis Newsletter


enjoy the rest of your week!


Matt

BPT MA Deluxe using 60 min chart to get better prices follow up

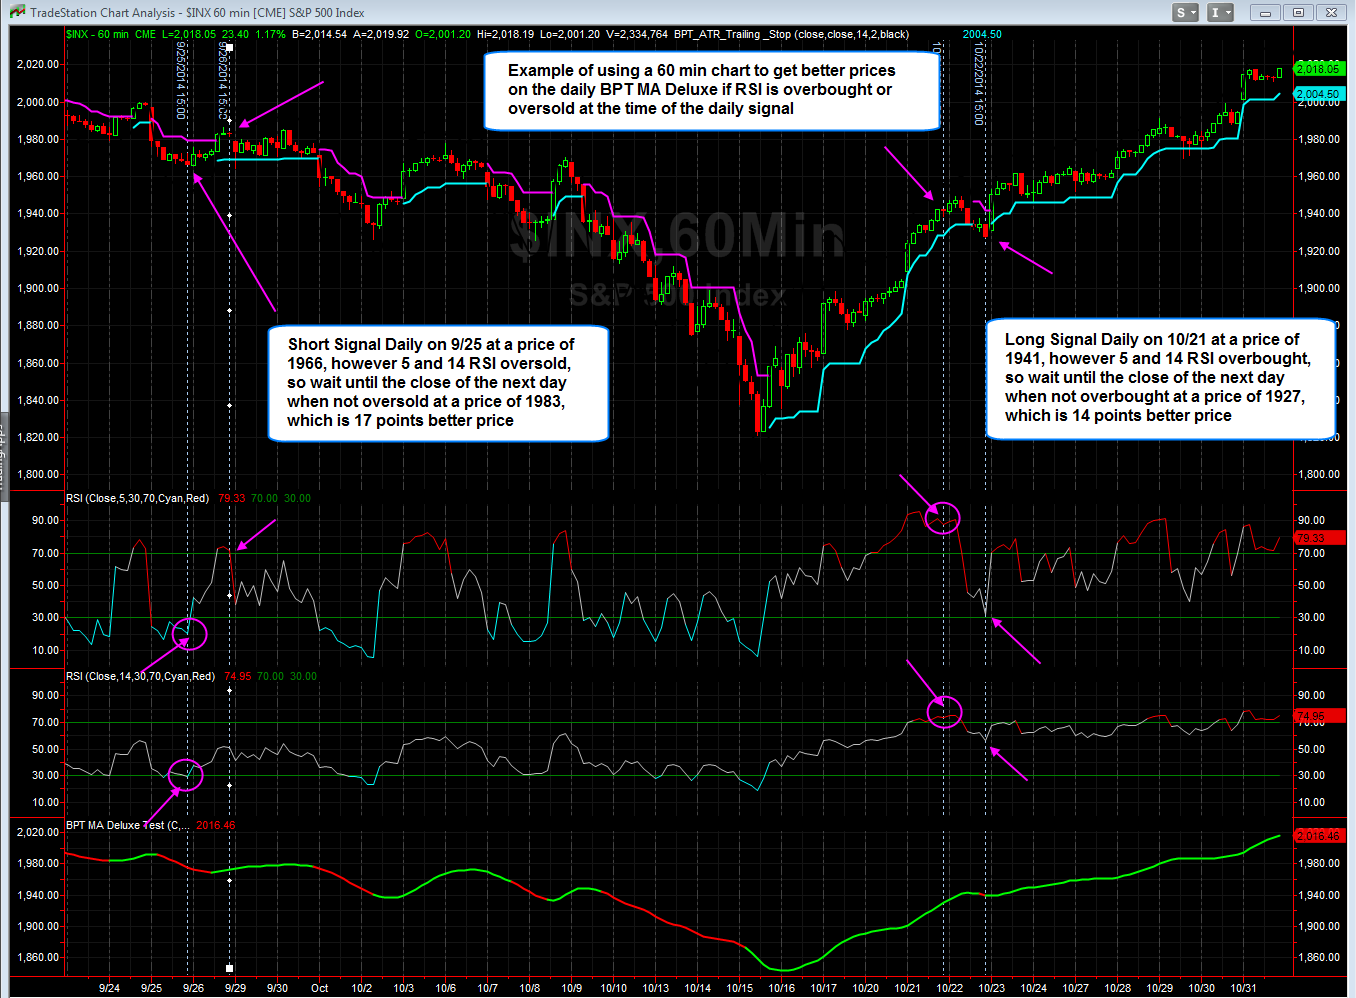
Hello guys, last weekend as you know I showed you some examples how when the daily BPT MA Deluxe gives a trade signal on the daily SPX chart, that one could zoom down to a 60 min chart to get better prices if the 5 and 14 RSI's were overbought (for longs) or oversold (for shorts), and you simply wait until the next day when these RSI's recycle. This of course is just common sense and could be improved upon a lot, however this exercise is to get you out of the 'robot mode' about taking the daily charts without looking at your intra day charts and other factors.  


The first image shows you two tables, the one on the left shows you the trade signals based only on the daily chart. The table to the right shows you the dates and prices if you used a 60 min chart to get better prices a day later if the RSI's were overbought or oversold at the time of the daily signals. If you look at the table, not every signal is better or different, in fact many of them do not change the daily signal (if RSI was not at extreme levels on the 60 min chart at the time, I simply take the daily signal as is).  For the columns, compare the dates, the # of days, and points better,and % Gain columns.  


The difference you will see is that some of the trade signals you are able to get 10 - 17 points better prices on the SPX. Also you will note that the average trade time jumps from 43 to 46 days, which is just common sense since you are typically waiting a day or so longer using the 60 min.


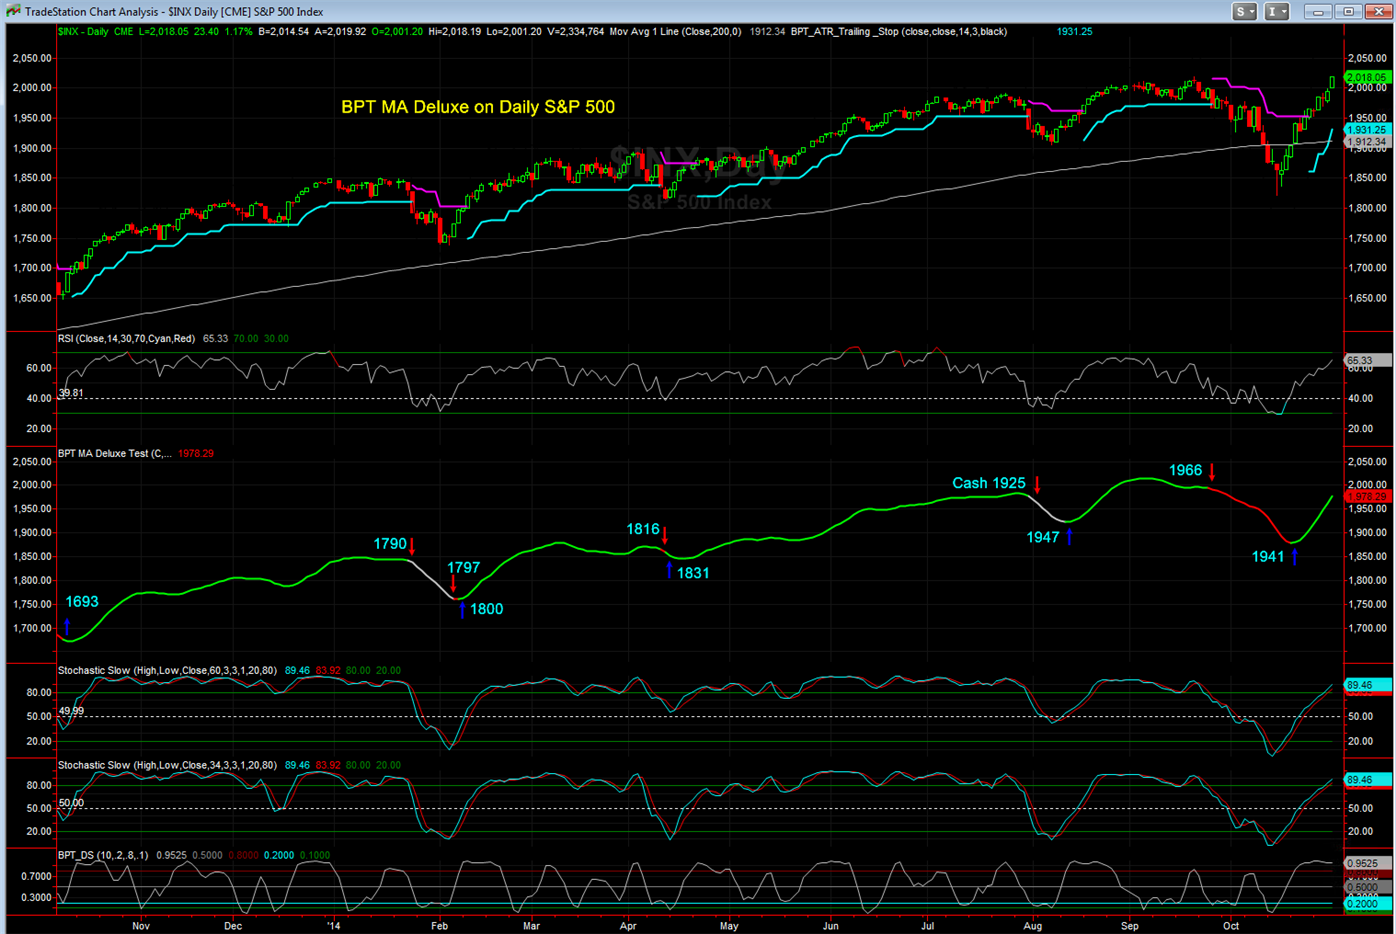
- The second image below shows you the daily SPX with BPT MA Deluxe signals noted (non - 60 min modified)


- The 3rd image below shows you the Current SPX with BPT MA Deluxe and the new signals based on 60 min


- The 4th image shows you a 60 min chart showing the current long trade, which would have been taken at 14 SPX points better prices, and the previous cash trade which would have been taken at 17 SPX points better prices.


I have not decided yet, I may in the future show the daily chart with the 60 min modification - however I would have to let you know in real time of course.