ANV - Chart Link - Man some of the corrections in the precious metal gold stocks from last October are amazing, such as ANV for example from from the low $40's to the $12's today. The best the 'bulls' can hope for is some kind of positive divergent low to form as long as it doesn't sell off too much more from here thus causing the divergence potential to be lost. If ANV can turn up and set up divergence then I might take a shot, otherwise just watching for now
Friday, April 5, 2013

Market Comments
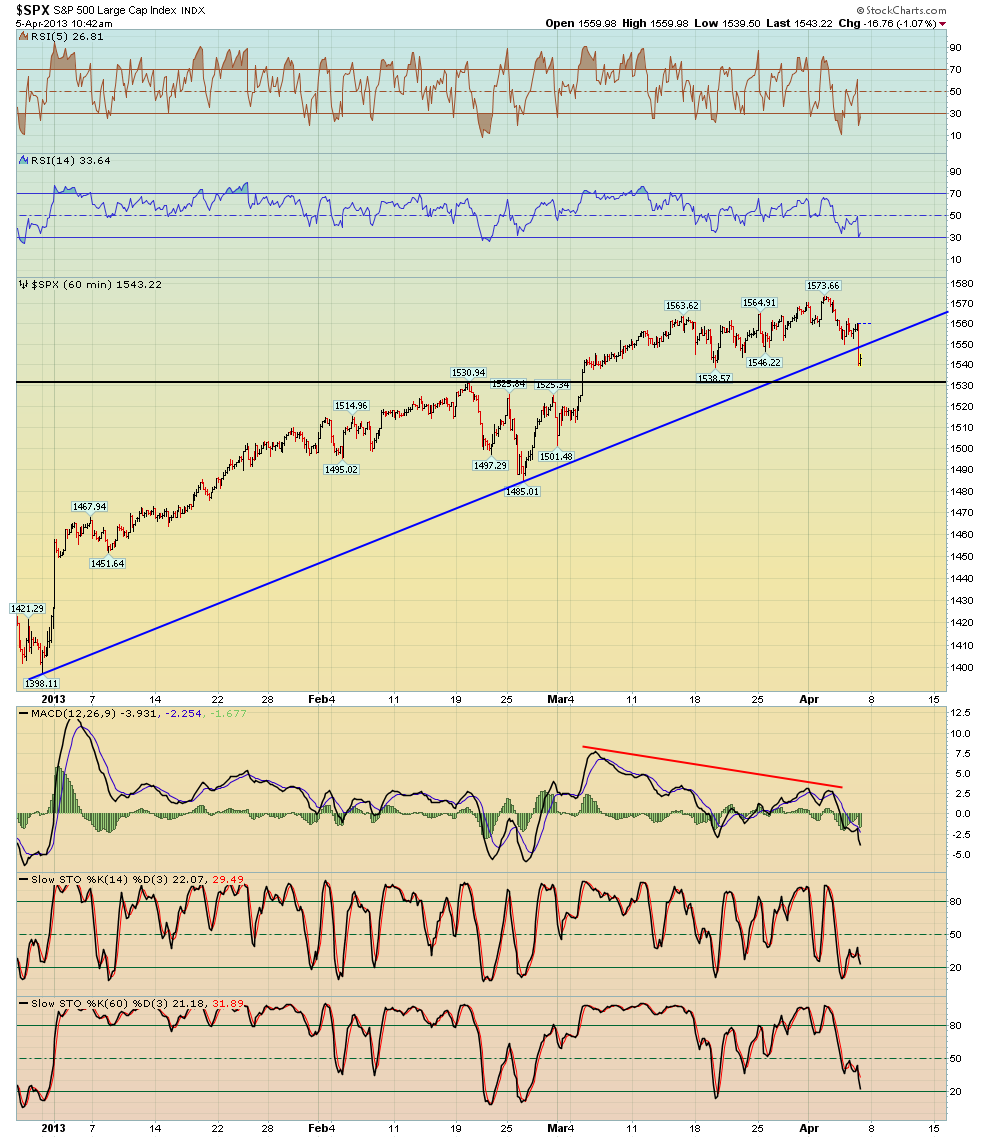
The first chart here shows a 60 min S&P 500 chart, as you can see it hit our initial target support near the 1540 area after the ending diagonal pattern played out. Now we just have to see what it does, if you shorted the market a few days ago from our newsletters you could either have take some profits or give it more room, congrats if you took some shorts before today!
I've attached additional charts that we are following. Over time the 50 day MA to the downside or a slight breach of it might be a target. Otherwise on a bounce, watch your Fibs as well as the broken trendlines to mark resistance points.


Nice pullback in the market, I hope you guys caught some of these shorts!
Nice pullback in the market the last couple days, I hope you guys caught some of our short ideas from our newsletters!!
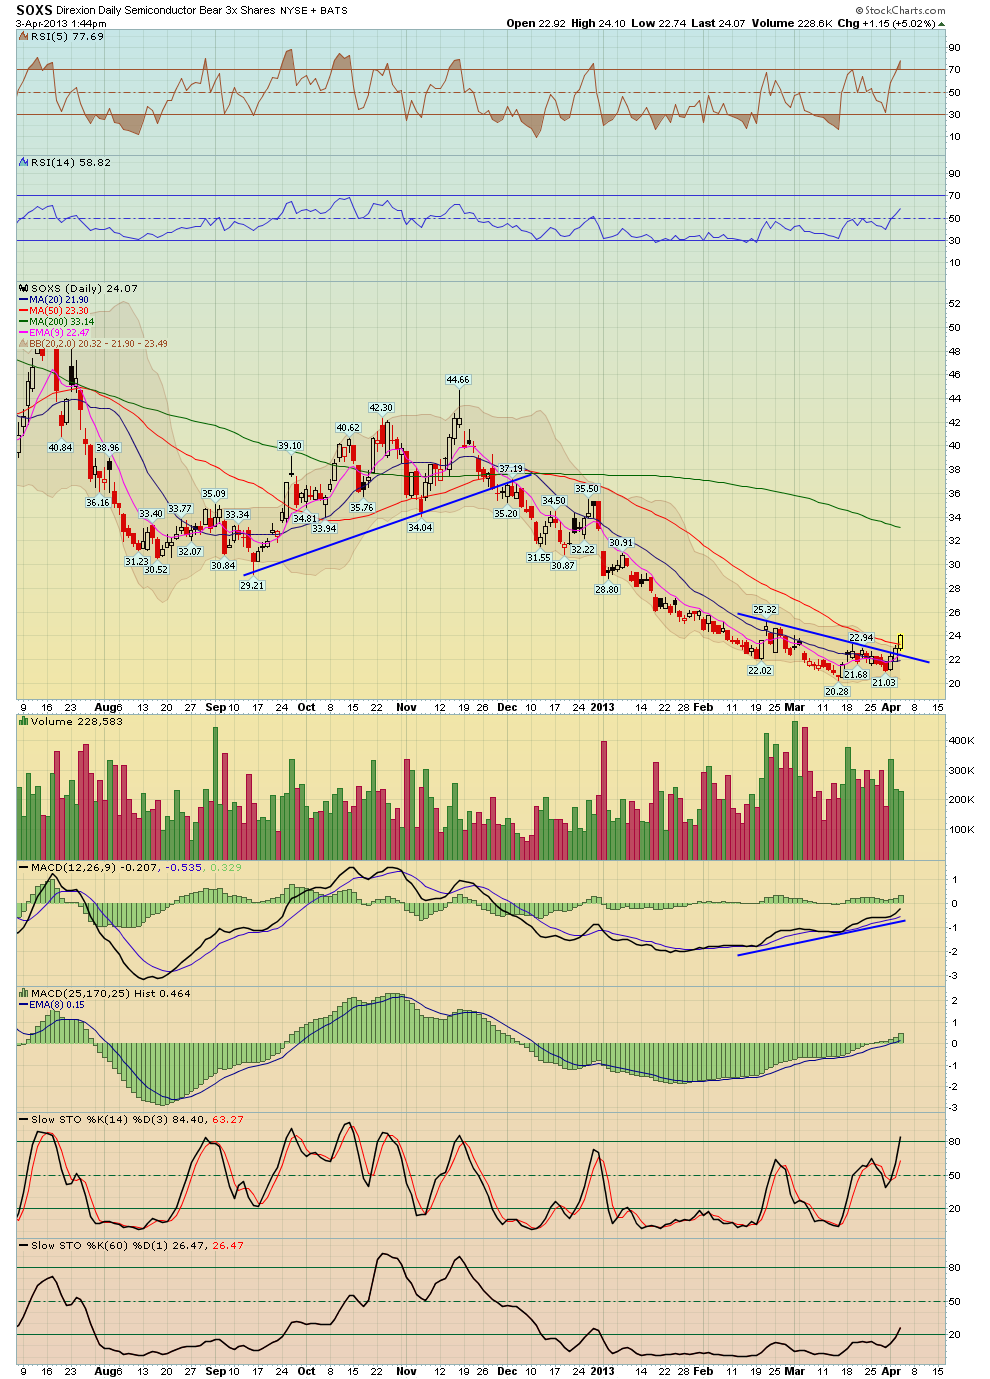
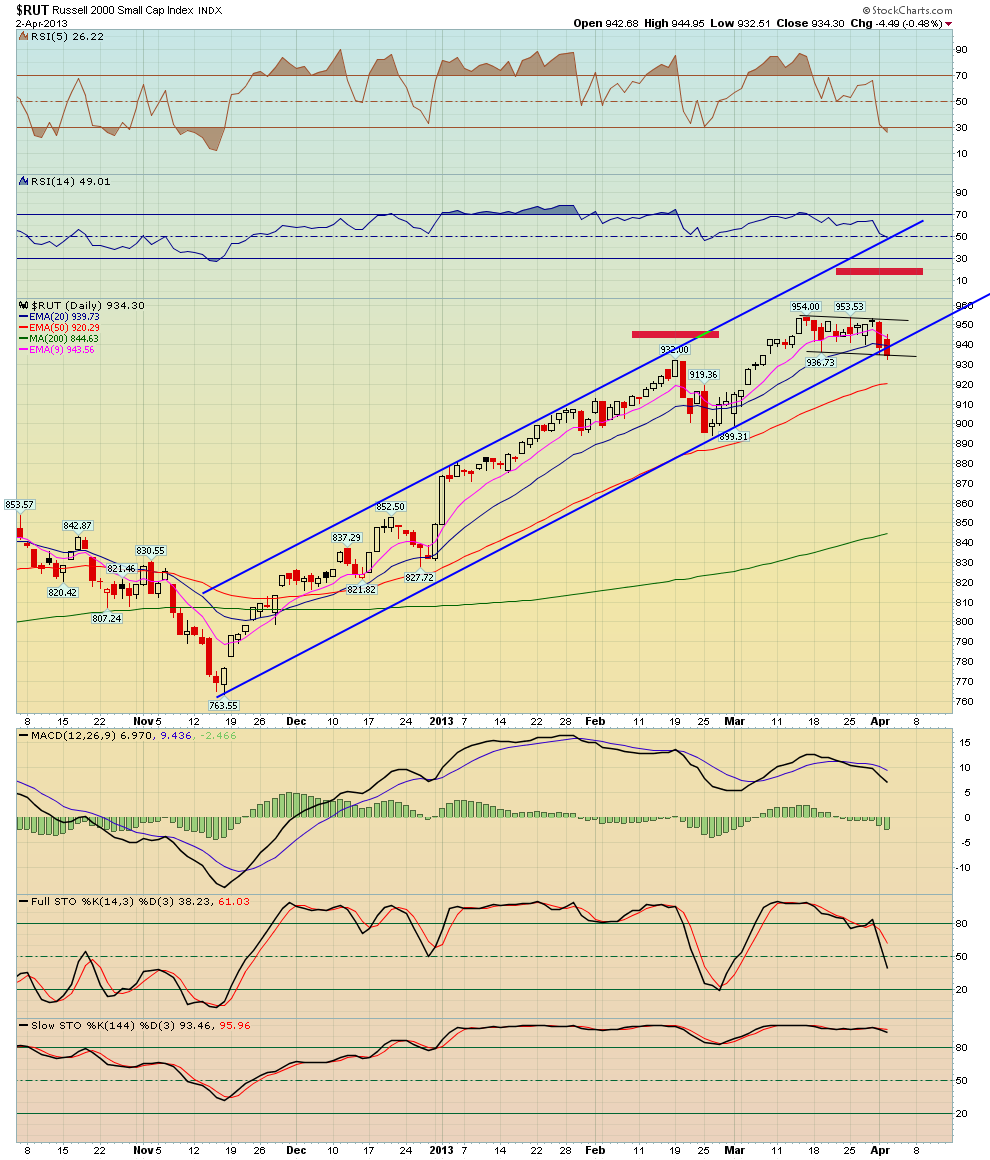
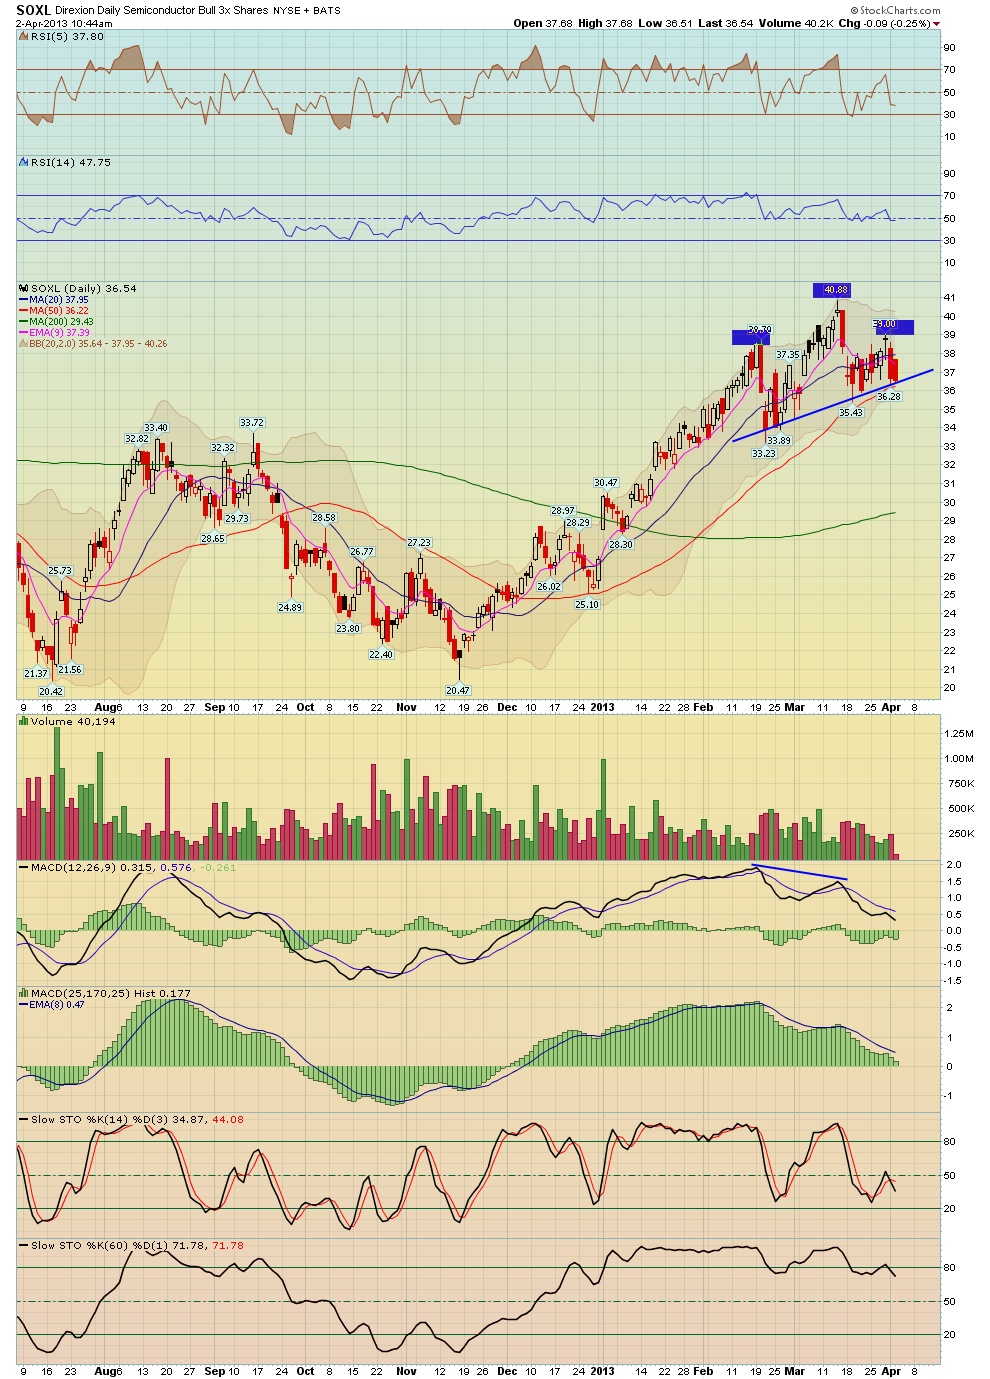
Semiconductor ETF's doing great, Russell 2000 short idea doing well,
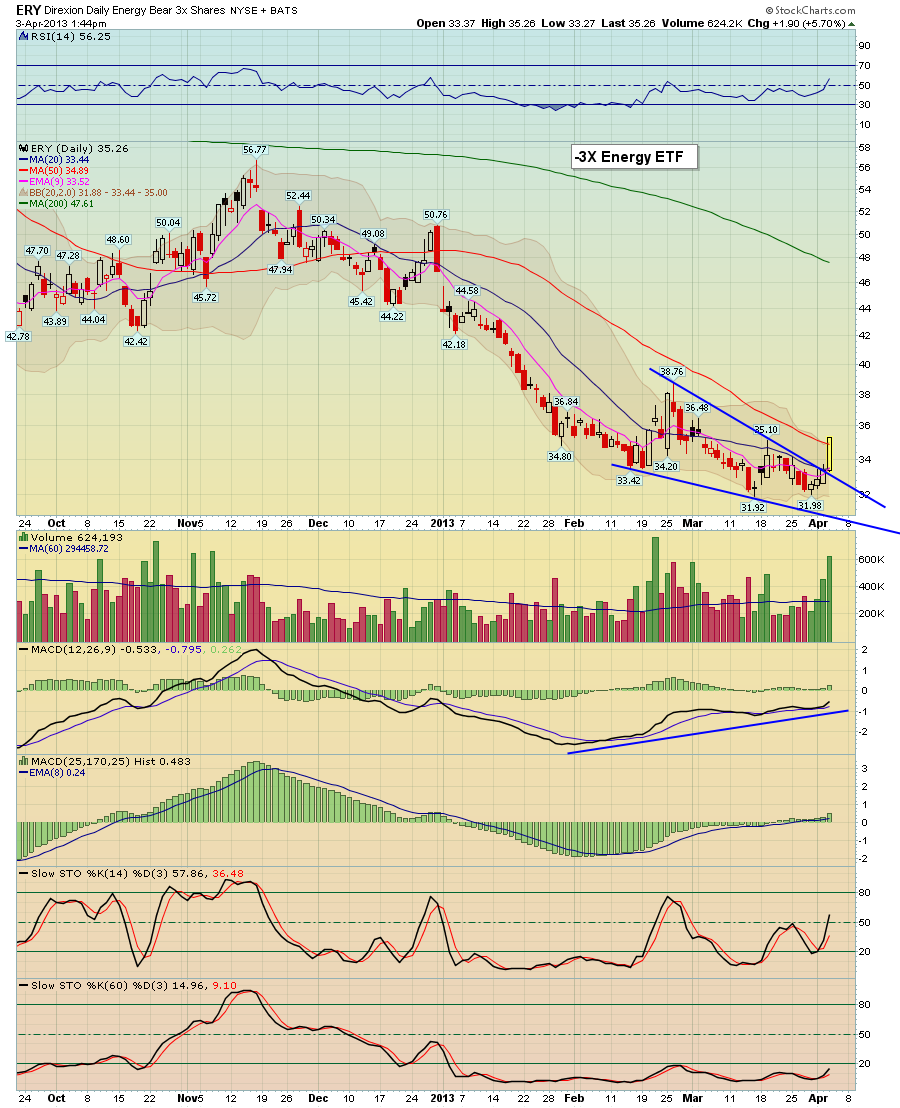
ERY (-3X inverse ETF) doing great!
The jobs number was negative this morning, the rate fell to 7.6%, however nonfarm payrolls were only +88K, which is the smallest gain in 10 months.
However that ignore the news, the market charts were all aligned for a pullback


Thursday, April 4, 2013
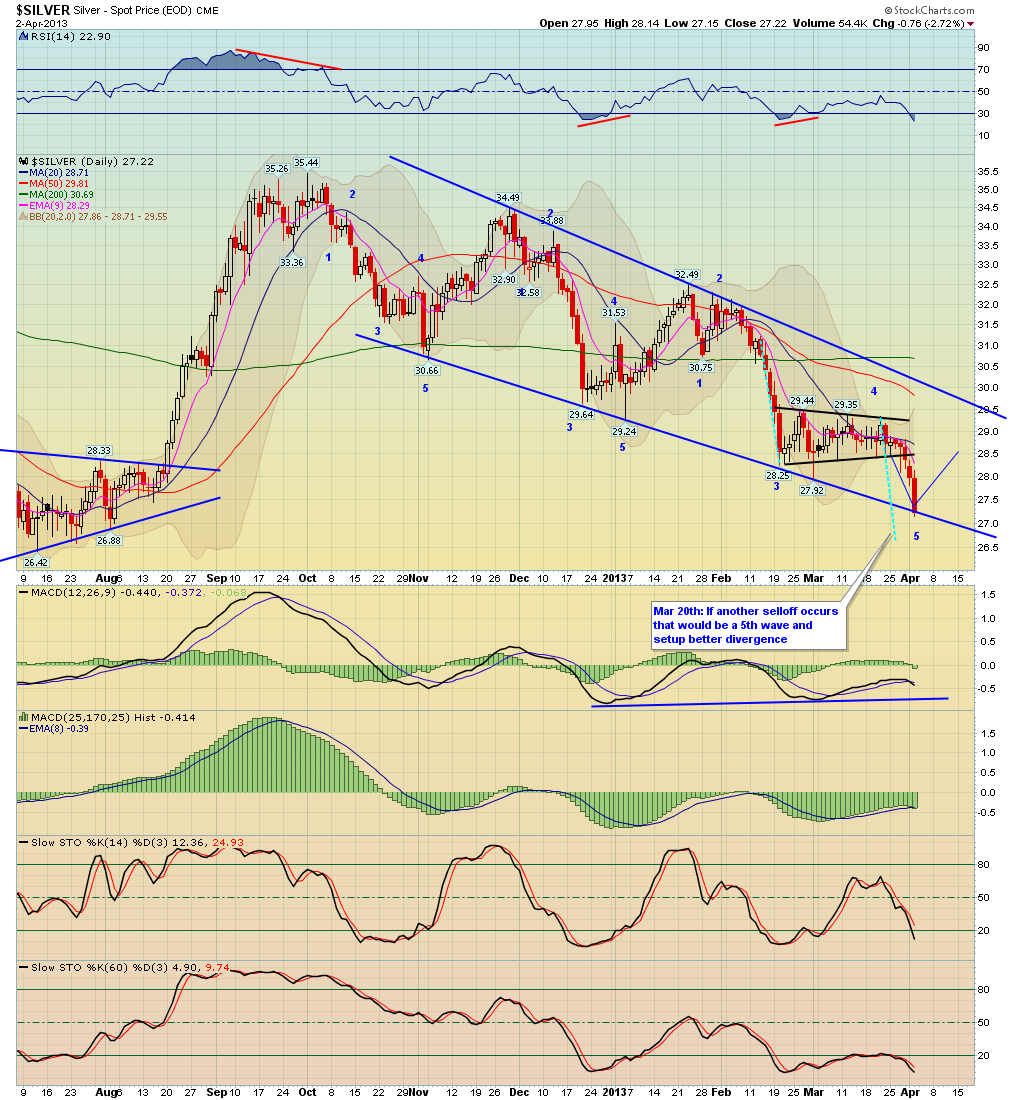
Amazing, Silver is actually testing the long term support area ...
Amazing, Silver is actually testing the long term support area again! It'st tested this area so many times now, one worries that it's like a boy jumping up and down on a frozen lake, if he does it too many times, eventually the ice breaks. There is some minor support at $25 (see the thin line below) but below that nothing until 20 or high $19's
However on the flip side since Silver is at major support, one could take a long here with a fairly tight stop!

Wednesday, April 3, 2013
NYMO and NAMO with Bollinger Bands
Note that the NYMO and NAMO indicators closed below their lower BB's today which has been a good guide at indicating bounces. However that said, price can run below the lower BB's for a bit and I think the odds favor that some kind of Head or top is in place for the market, thus I think any bounce would simply form a lower high at this point.
Remember we have the Jobs report this Friday and of course North Korea saber rattling, so volatility is expected.


Nice market sell off today, congrats if you took positions in our trade ideas
The market finally has a decent sell off today, perhaps sometimes of intermediate top is finally in place, that should surprise no one.
Otherwise here's some recent trade ideas that we have been showing in order to take advantage of a pullback in the market.
SOXL is the 3X inverse ETF for the Semiconductors Index, as noted in previous posts below it sported a H&S top, it's now breaking down quite nicely, congrats if you caught this trade!
SOXS is the 3X long ETF for the Semiconductor index, it's up nicely off the bottom, congrats if you took this trade
The Russell 2000 started to break down the other day and has been lagging.
We also noted that the energy sectors were weak such as the XLE which sported a bear wedge pattern and an absolutely perfect H&S pattern on the 15 min chart. We provided ERY, which is the -3X ETF as a trade idea, as you can see it's doing quite well, congrats if you caught this.
otherwise let's see how the day closes. For faster updates, please subscribe to your paid service: Currently our 6 month membership is the best deal at 50% off our standard monthly rate, here's a URL to our signup page
Matthew Frailey


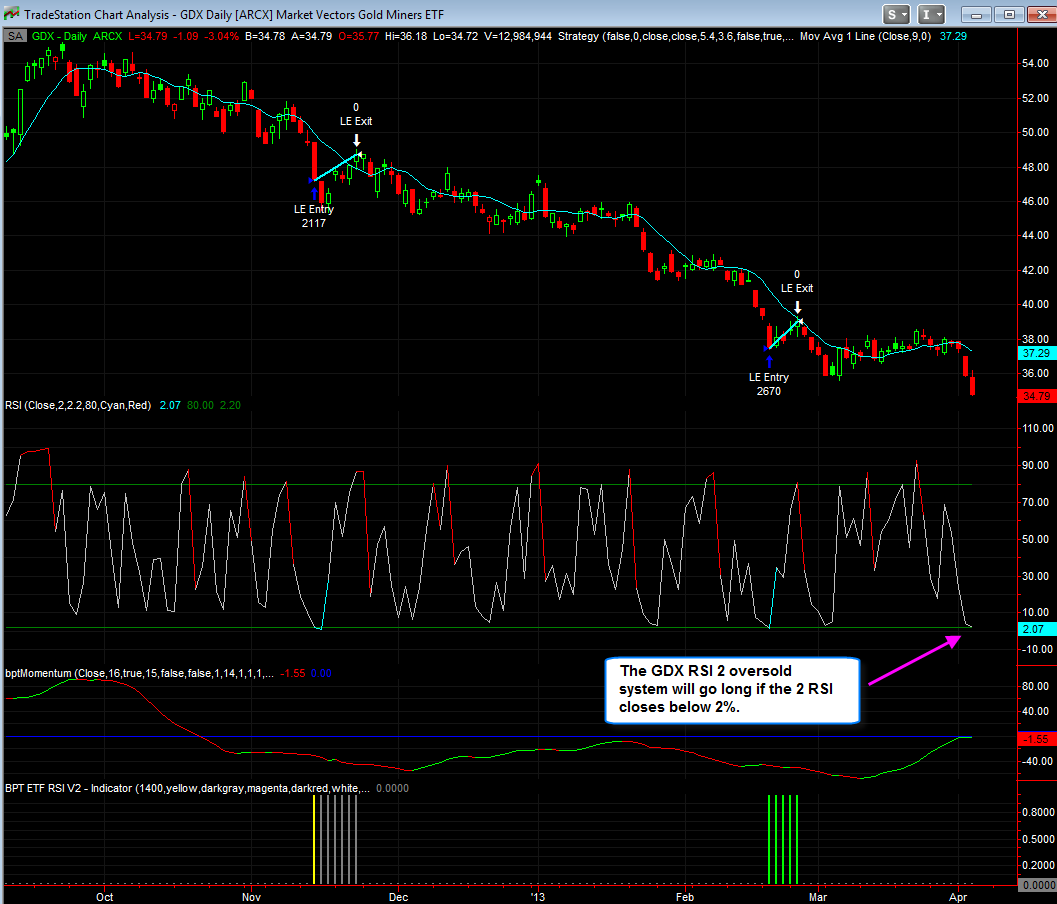
GDX RS2 2 indicator is very oversold
A while back I posted an oversold RSI 2 system for GDX, the system last did a long trade back in February for a quick trade. Currently the RSI 2 is at 1.6% and if it closes below 2.1%, the system will take a long trade. Therefore monitor the RSI 2 and see how it closes, again it needs to close below 2.1% in order for this system to take a long.
Here's the performance report and statistics
click here for the full system report, it will open in Internet Explorer
I've also attached a static image if the general statistics.
Note: This is NOT a traditional RSI 2 Larry Connors system because those systems will only take longs when price is above the 200 MA. I turned off that MA so that I could what would happen if you ignored it. As you can see from the stats, it's a rare event, about 95% of the traders were winners with the largest losing trade only being 0.75%. HOWEVER that is deceiving because the system can take quite a bit of heat at times if it buys too early before GDX finally bounces. Here's a video I made back in February which shows this.
GDX RSI 2 system where trades are only taken when price is above the 200
day MA - this only occurred 10 times over the last 6 years since GDX
has been trading, none of he trades were losing trades - clearly we
don't have this setup since GDX is well below the 200 MA
Tradestation Reports:
GDX RSI 2 and price above 200 day MA - no losing trades
GDX RSI 2 - price can be above or below 200 MA
Again I'm posting this for informational purposes only.
My students who have the Tradestation Systems - already have this system and others on their computer
As always this is not a recommendation to buy or sell - this is for
informational purposes only, you make your own trading decisions.

Capitulation in gold stocks
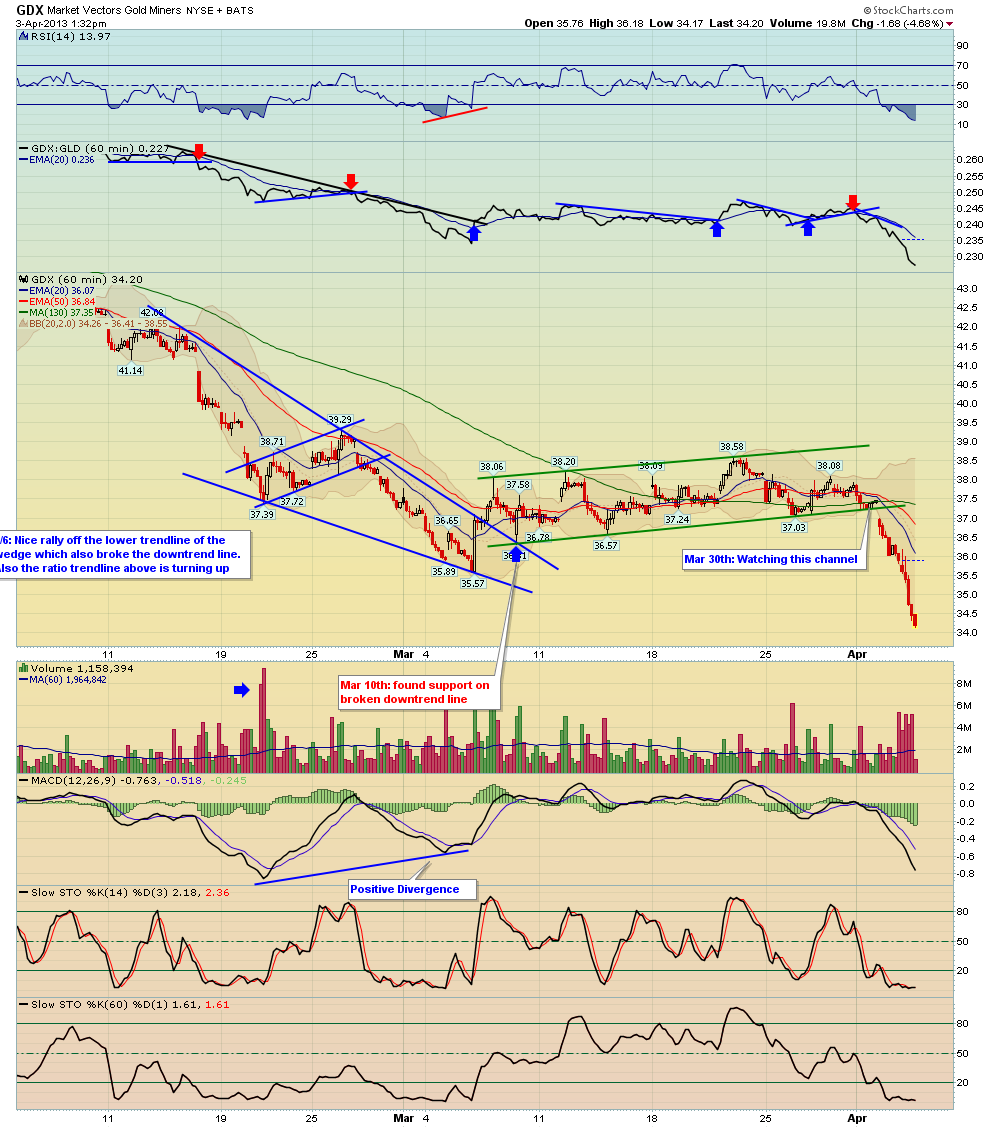
Looks like a capitulation is finally occurring in the precious metals stocks, both the HUI and GDX have now taken out their February lows, which is not a surprise given the choppy advance bear flag pattern that had formed - see the charts.
Perhaps this sell off will finally cause some of the die hard gold bugs which have been hanging on the dear life to finally throw in the towel.
In the short term watch to see if the lower trendline of the channel may act as support. Also be on the lookout for a reversal or hammer candlestick which would may market a capitulation.
This has been the worst sector in the market bar none.


Tuesday, April 2, 2013
Wednesday Morning April 2nd, 2013 Newsletter
Here's our comprehensive market newsletter, this is an important newsletter because the market continue to display signs of topping...raise stops/take profits and be on alert for clear reversal (sell signals). have a plan of action in place.
**Click Here** to view the newsletter
best to your week!
Precious Metals, Gold, Silver, Gold Stocks
The precious metals market continues to melt down, especially the stocks.
1st chart: Silver broke down from the bear flag that we have been showing for the last couple of weeks, the hope now is that this is a wave 5 of some sort and positive divergence will kick in.
2nd chart: However the second chart shows a longer term view of Silver, it's now at the bottom of a channel (see the black trendlines), and is nearing major support in the mid 26 area, it had better hold that major support because the next major support doesn't come in to about $20!
3rd chart: Shows a chart of gold, it continues to sell off and is not far away from the lower support channel.
The last chart: Shows a chart of the HUI gold bugs index, precious metal stocks have been the worst sector in the stock market; the HUI spent the last few weeks forming a bear flag 4th wave consolidation pattern which finally broke down hard to the downside. We have been warning you about the lack of impulsiveness in the gold stocks on the bounce, which meant that it was a corrective move i.e. 4th wave consolidation. Now the best we can hope for is for a 5th wave divergent low to manifest. The HUI has lost 36% of it's value since the Sept 2012 highs!


General Market Analysis April 2nd, 2013
Here's my short term thoughts on the market recorded as a video:
**CLICK HERE** to watch the video
best to your evening, Matthew Frailey
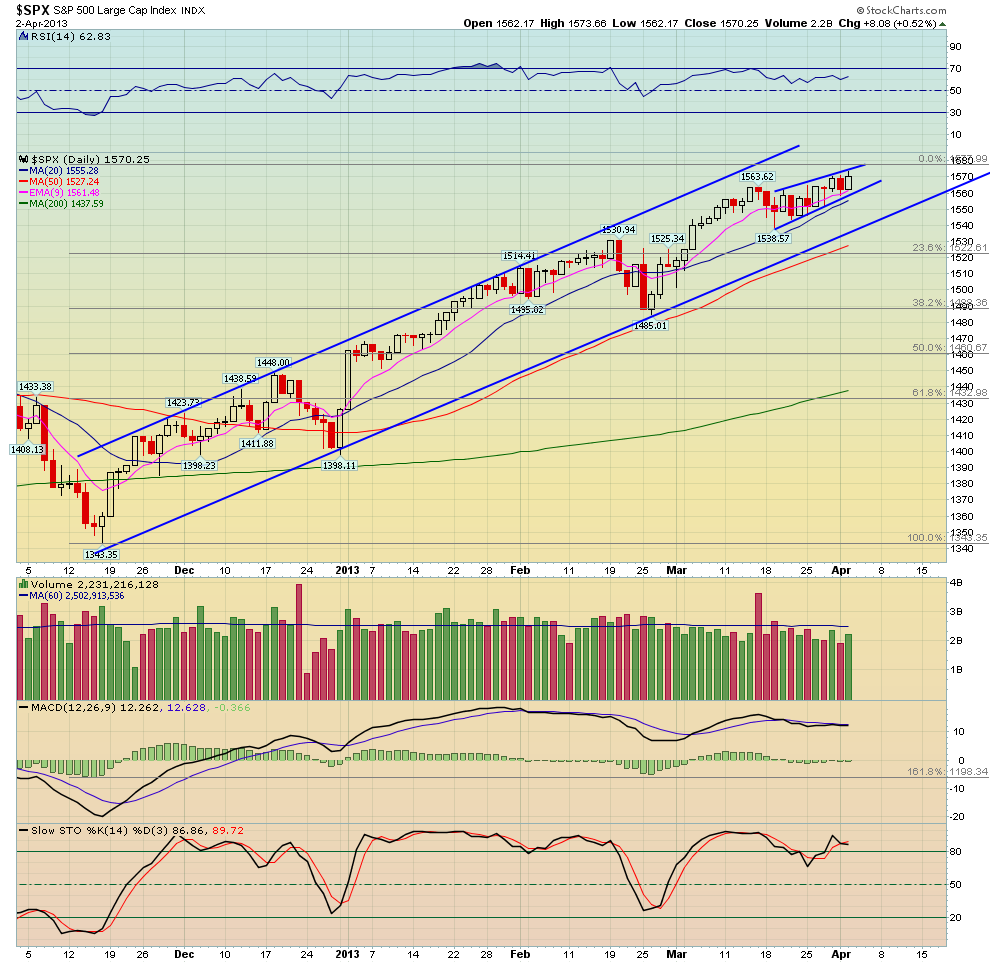


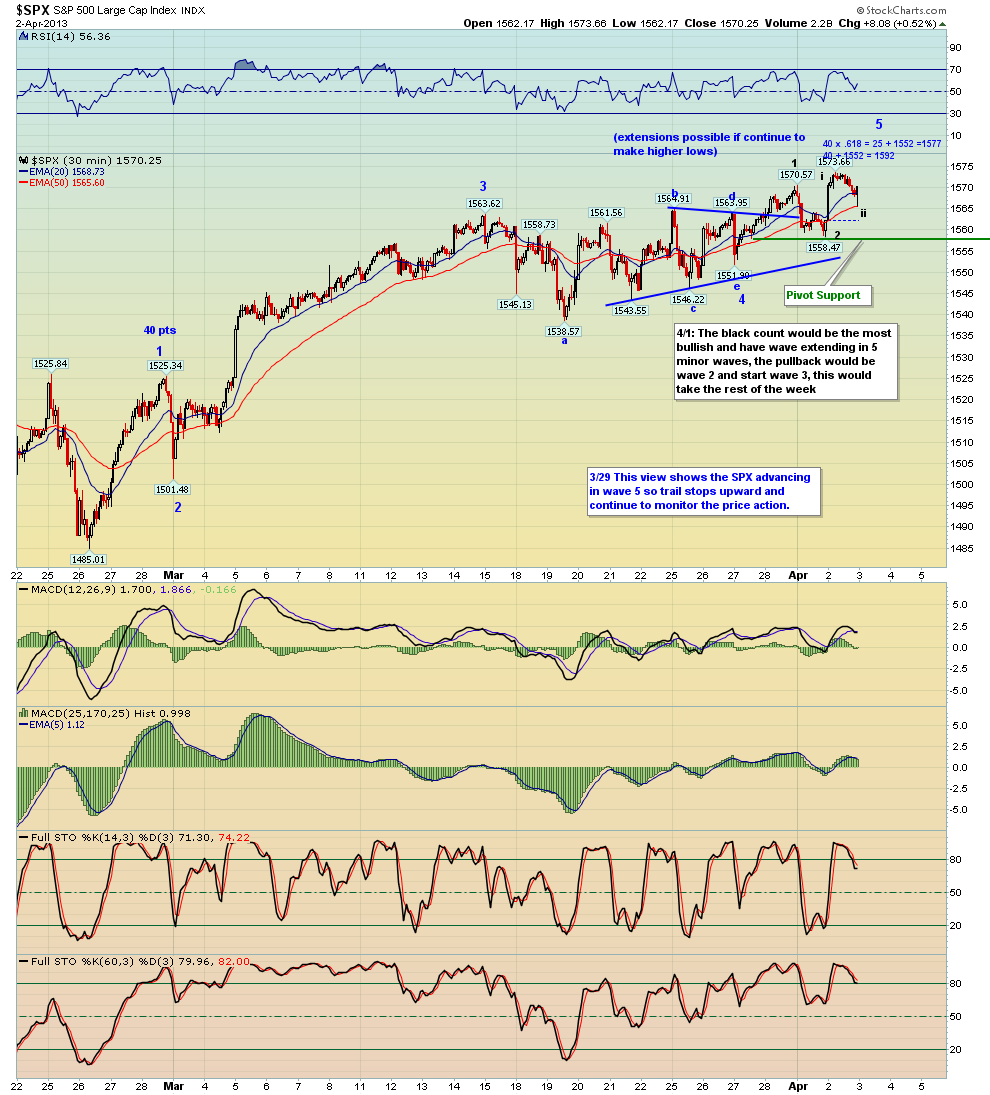


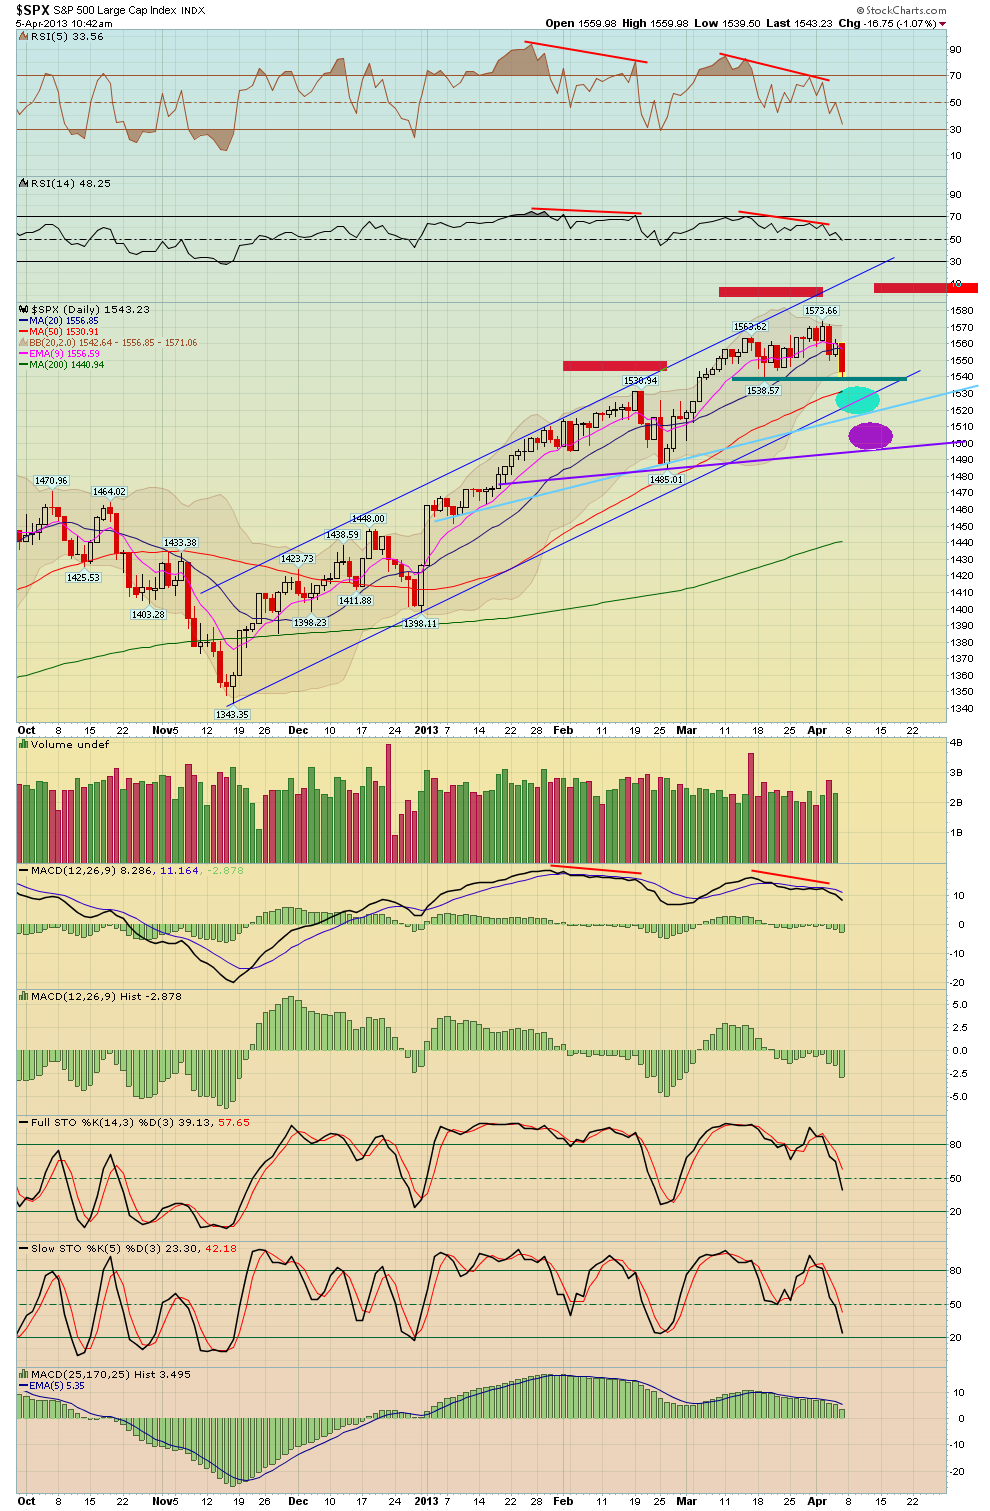
S&P 500 nearing the all time high
The market is now only 2 1/2 points away from the all time high of 1576 on the S&P 500. As I stated a while back, that high is like an itch that needs to be scratched LOL.
See my recent newsletter on Monday to hear my comments about the short term wave counts.

Semiconductors - potential H&S pattern forming
Even though the market is up at all time highs today the Semiconductor sector and ETF's are down. One thing that I noted in my newsletter on Monday is that the Semiconductor sector is sporting a potential H&S top!

Monday, April 1, 2013
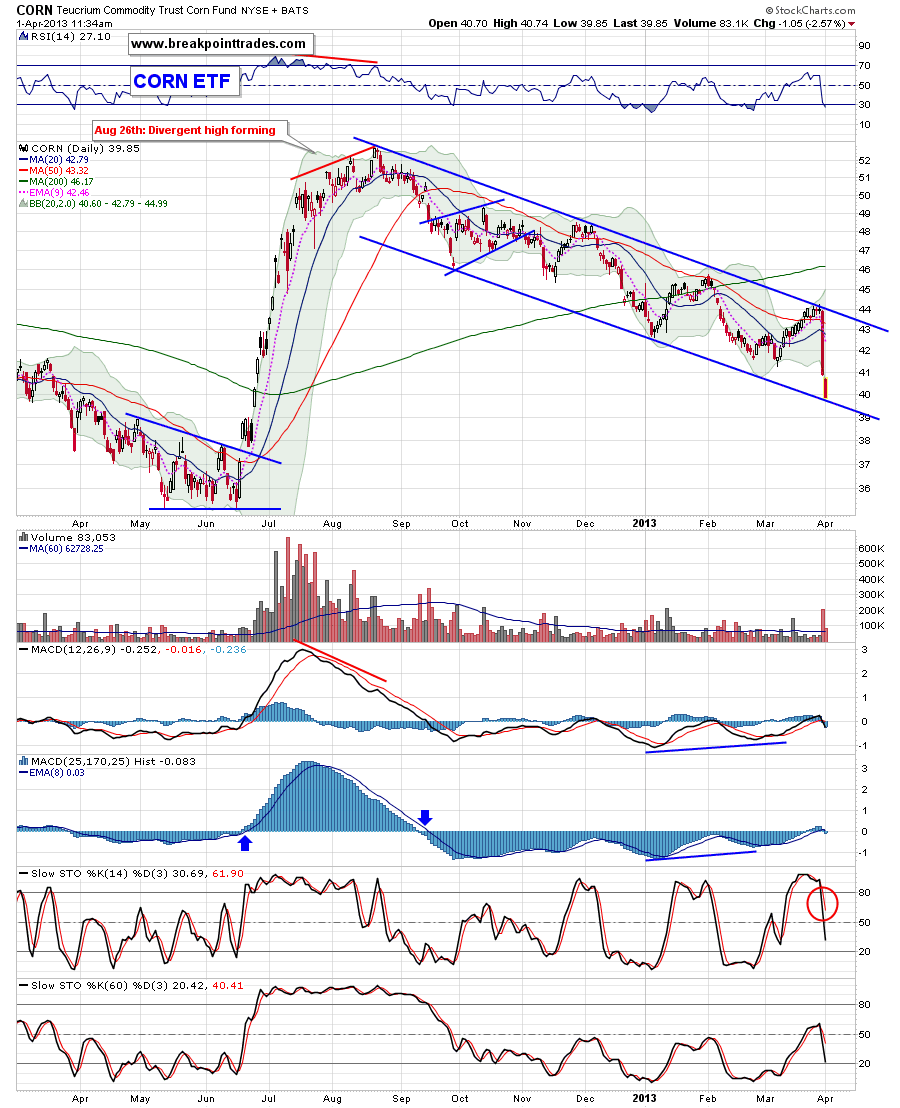
Corn
Corn is down once again today and is now testing the lower trendline channel.
Corn was down last Friday the most in 70 years on record planting, however technically it's not a surprise because it's been in a downtrend since topping out late last summer
General Market Newsletter - Market toppy?
Here's our General Market newsletter (non commodity). For those of you looking for a top to this market soon, reference this newsletter and charts
Subscribe to:
Posts (Atom)