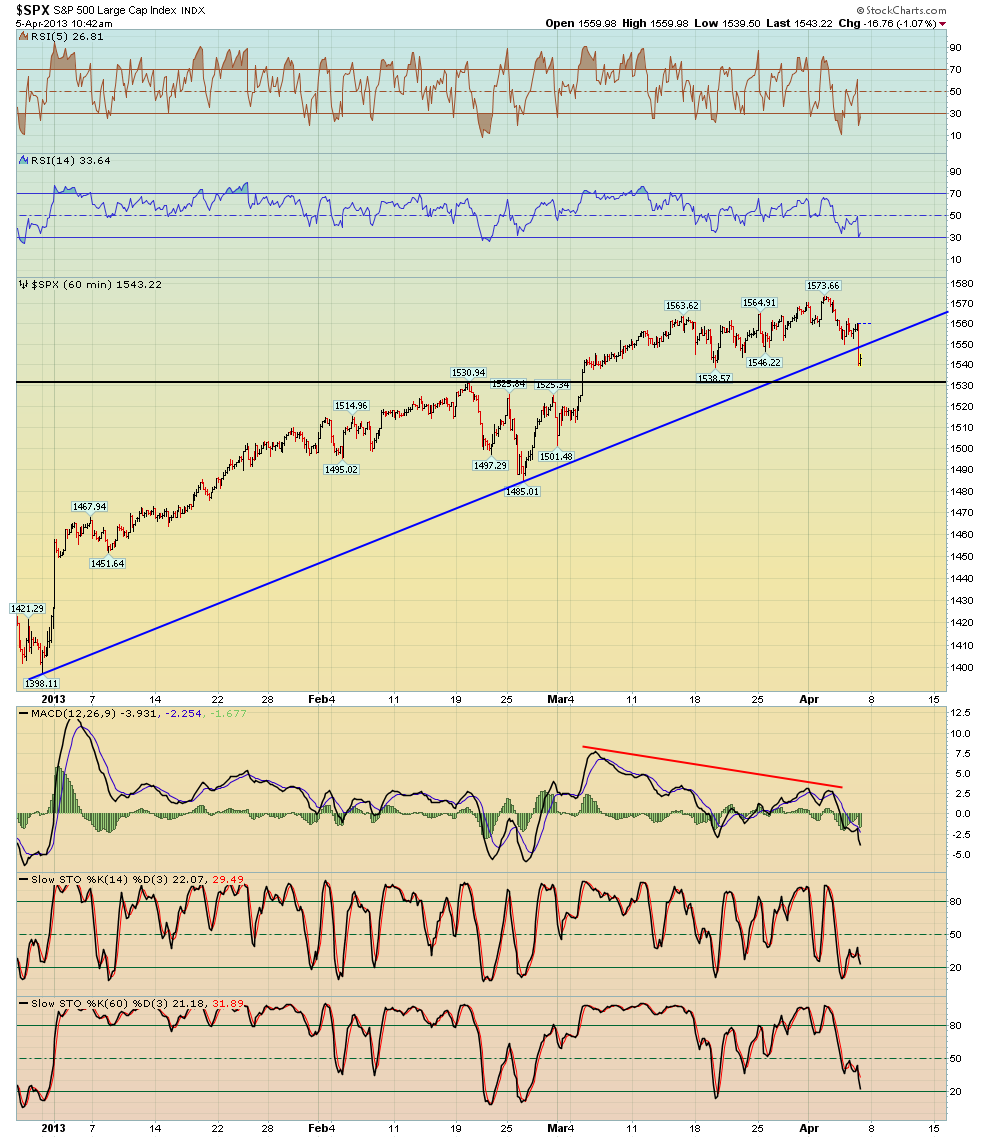
The first chart here shows a 60 min S&P 500 chart, as you can see it hit our initial target support near the 1540 area after the ending diagonal pattern played out. Now we just have to see what it does, if you shorted the market a few days ago from our newsletters you could either have take some profits or give it more room, congrats if you took some shorts before today!
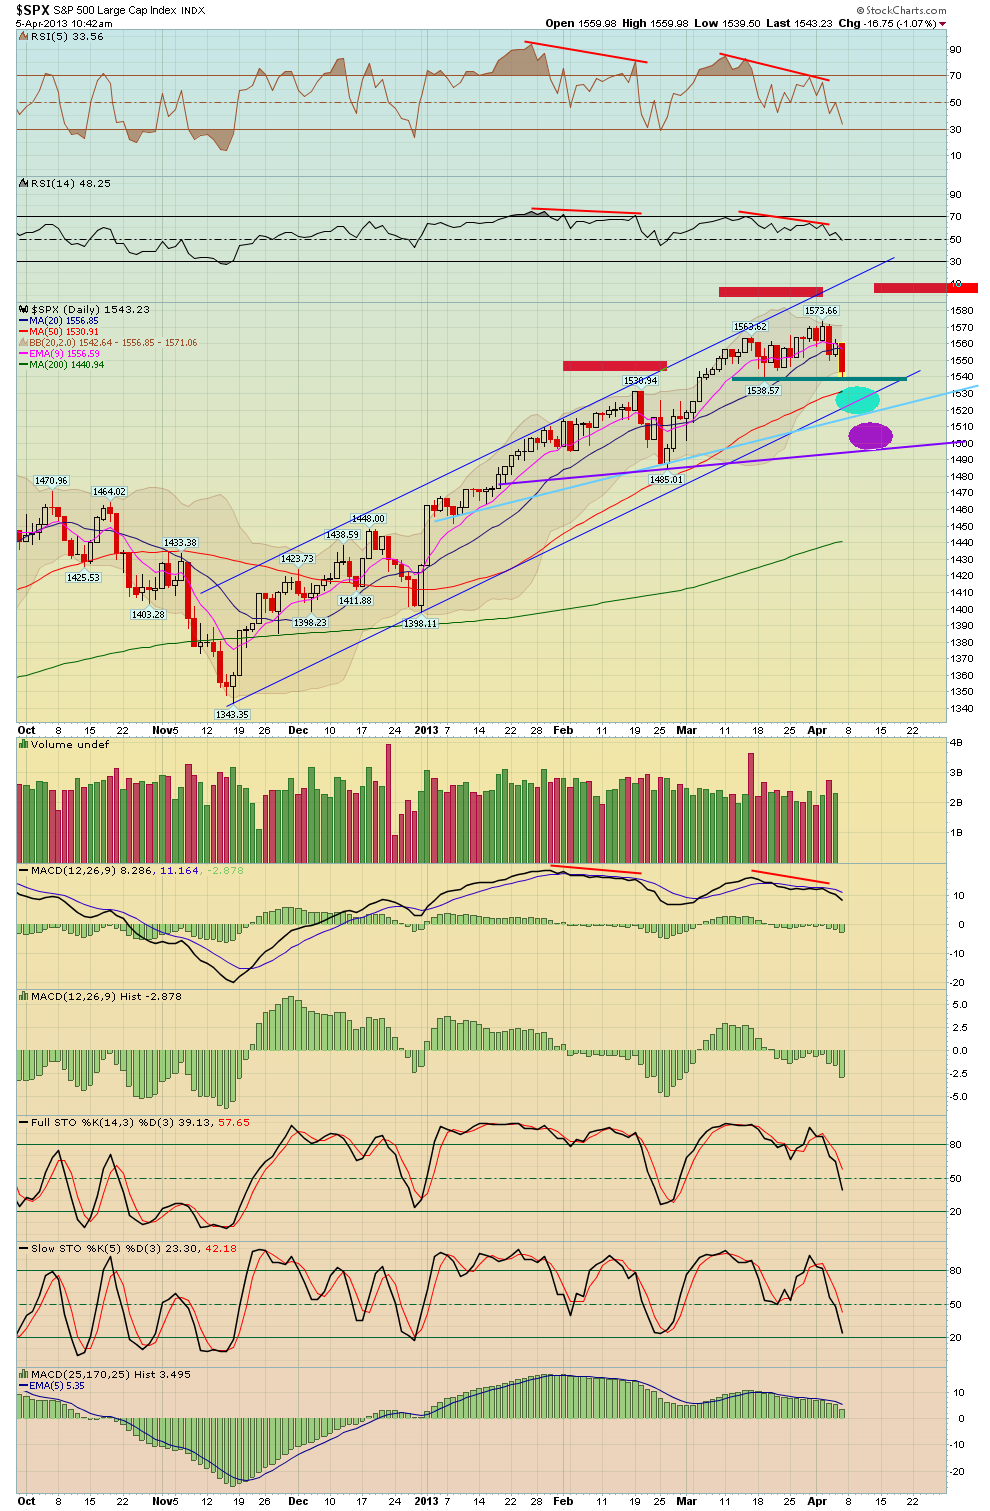
I've attached additional charts that we are following. Over time the 50 day MA to the downside or a slight breach of it might be a target. Otherwise on a bounce, watch your Fibs as well as the broken trendlines to mark resistance points.


No comments:
Post a Comment