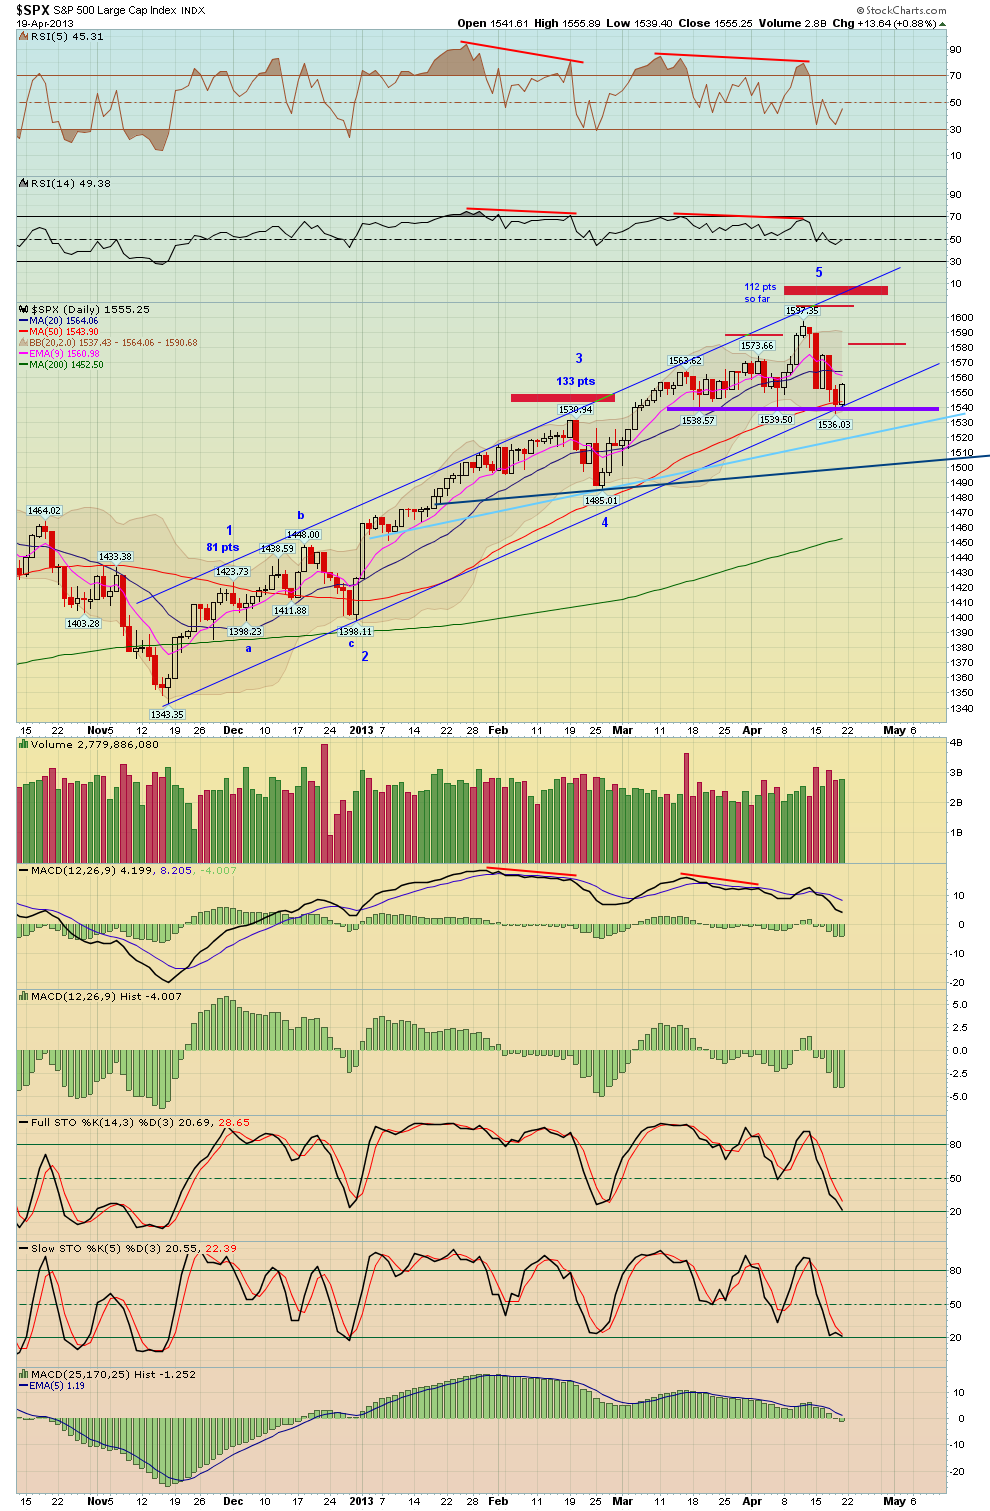
In my post last week, I showed how important the 1540 ish are was on the S&P 500, and the S&P 500 clearly rebounded off that as well as the 50 day moving average. Early this I would love to see follow through to perhaps test the 20 MA or 9 EMA above, this would provide a lower risk short opportunity. See the daily chart, a bounce and consolidation could form a small RS of a H&S top, which would portend to a nice sell in May event!
The second chart shows a 60 min chart, watch for the broken uptrend line of the channel to provide resistance.
The third chart shows a 15 min chart along with Fibonacci retracements.


No comments:
Post a Comment