A few of you wrote me to ask me for my analysis on AAPL since we have covered it so well the last year, here's my thoughts:
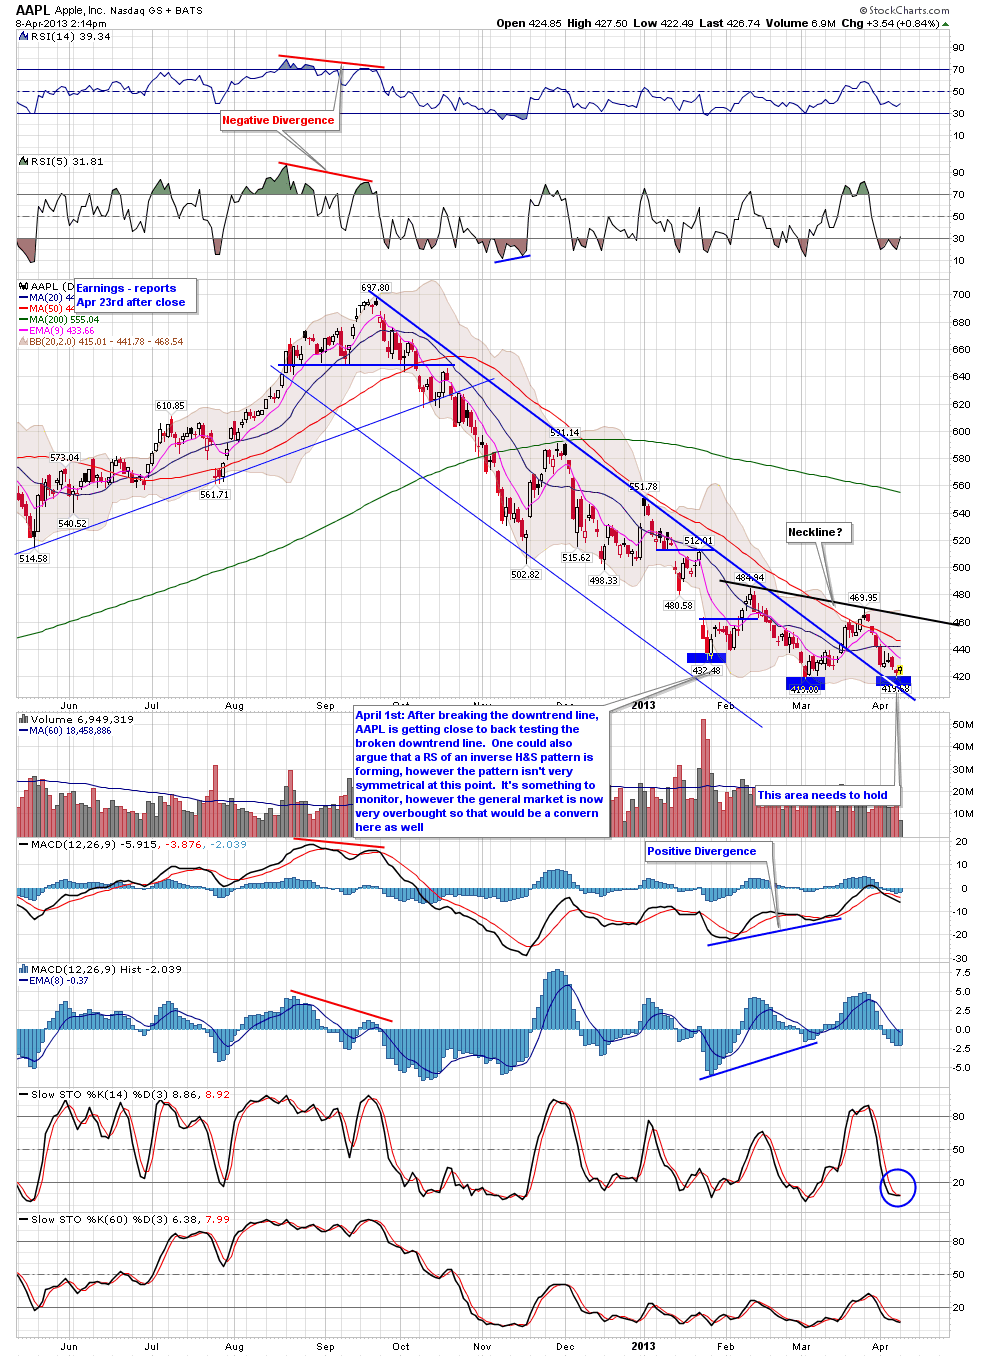
The first chart shows a daily chart, one of you asked if a slanted inverse Head and Shoulder pattern could be forming with the right shoulder currently in the process of forming. Yes it's a valid pattern for now, however you don't want to see price dip much lower otherwise it will lose symmetry. Otherwise the broken downtrend line is also a support area, a stop could go below there.
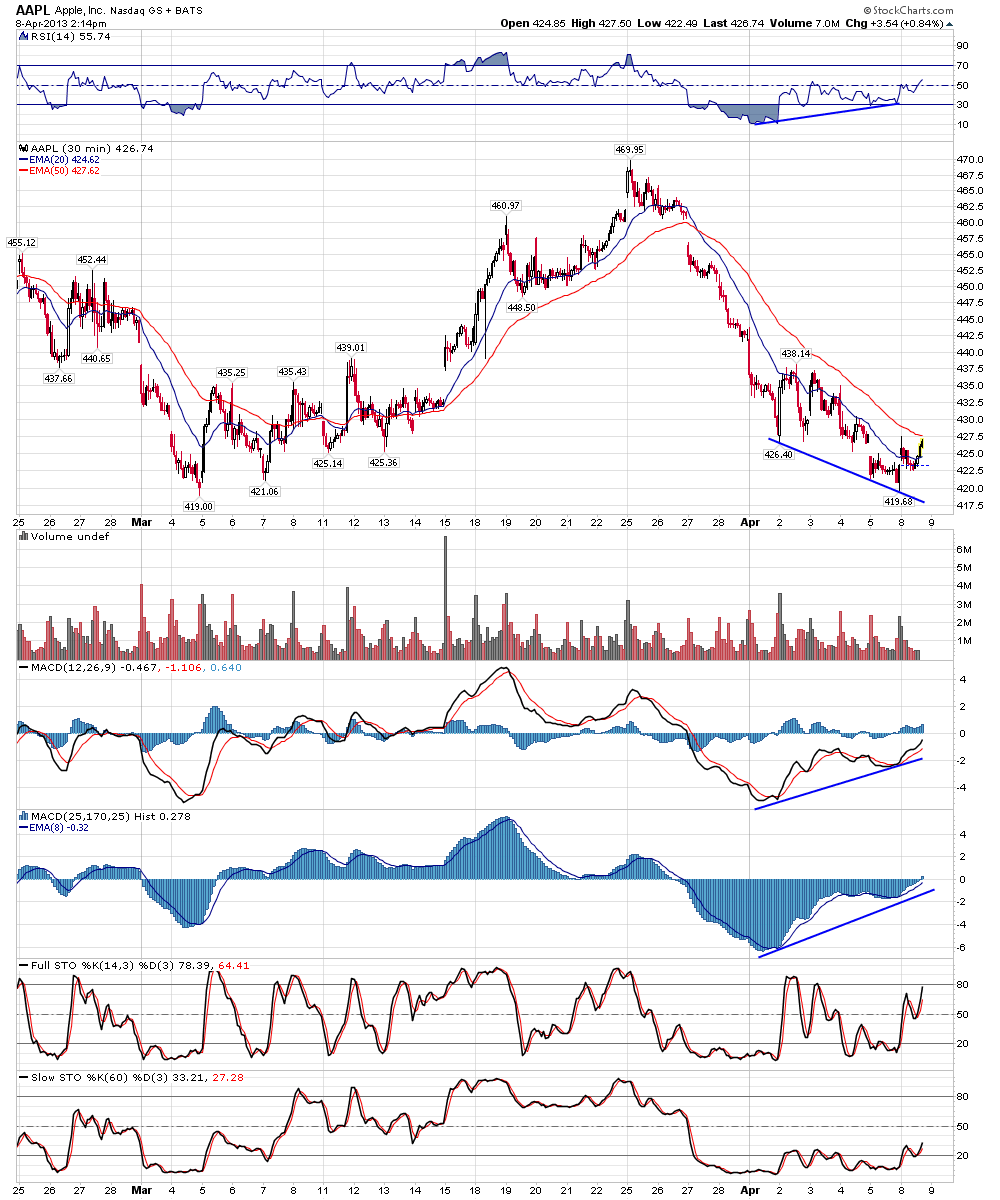
The next two charts show 30 and 60 min charts of AAPL, there is positive divergence via the MACD and RSI indicators, therefore a bounce potential exists.
My only concern would be the general market, if this pattern had formed a while back, while the market still had a lot of room to run I would like it better. If the general market decides to have a correction, could AAPL bounce that far? Probably not. Of course that's the question in the short term, has the general market starting some kind of correction, or is it simply consolidating for another push higher? Currently the S&P 500 has retraced 50% of the pullback from the April 2nd highs, so we'll see.
Let's see how AAPL plays out over the next week or so

No comments:
Post a Comment