Crazy day for gold so far, it was down -$140 a few moments ago!
Here's two charts of interest: However please note that these don't reflect today's moves yet as they do not until until this evening at Stockcharts.
The first chart shows a daily chart of gold showing a measured move projection based on the height of the rectangle pattern
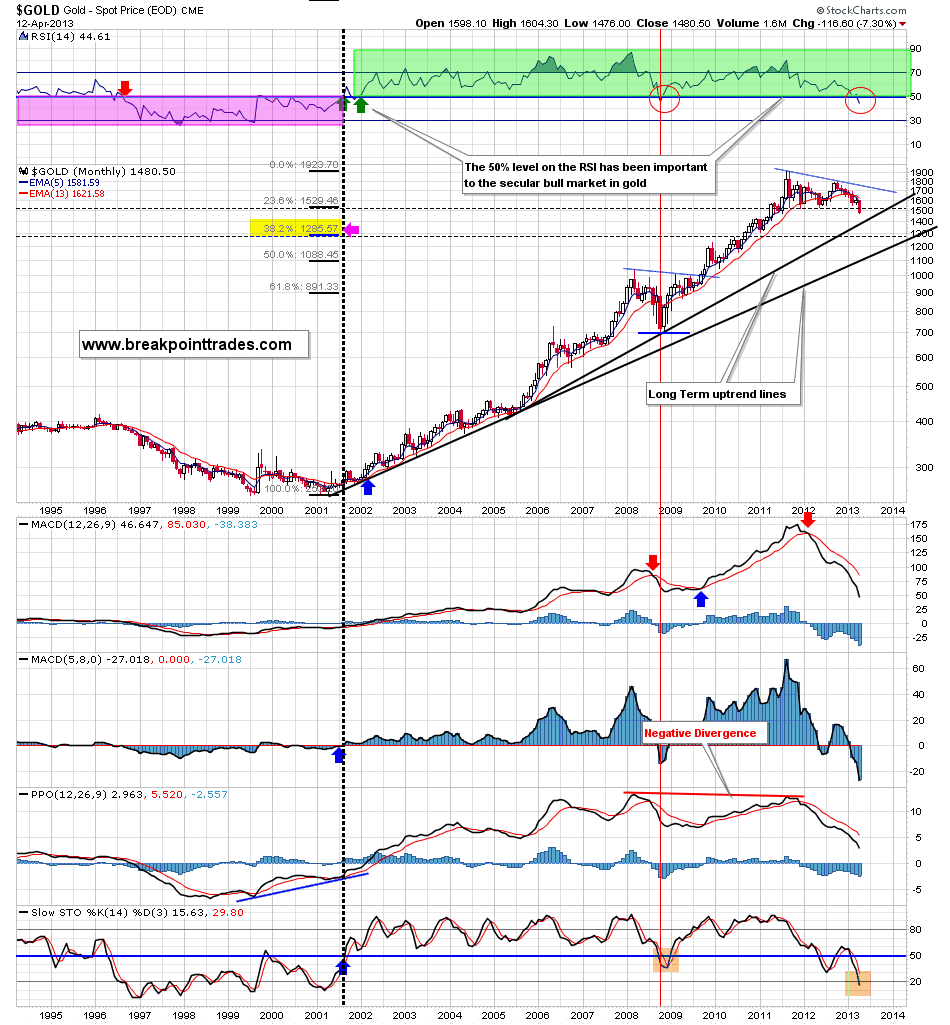
The second chart shows my monthly chart, note that the 38% Fibonacci rectracement of the entire move from the 2001 lows to the 2011 highs roughly matches the rectangle projection.
The third chart shows Fibonacci retracments taken from the 2008 lows, the 50% Fib is at 1300


No comments:
Post a Comment